Recently, the American salary reality has shifted. According to JobLeads data, American job seekers expect $143,041. Employers are offering $109,709. That $33,332 gap is the largest we found anywhere in the world–and it's not closing.
Paradoxically, one of 2025's most significant policy developments was state minimum wage increases implemented in January. Which means that, even though the minimum wages increased in twenty-one states, overall salaries still decreased significantly.
This study analyzed 811,000 active job postings and data about 245,000 applicants' salary expectations to discover the discrepancies between what the job seekers want and what companies offer.
Key findings at a glance:
- Global salary gap stands at $10,411 a year
- The US has the highest salary gap of $33,332 a year
- France is the only country that has lower expectations than the actual salaries offered
- Applicants in the Sales industry experience the largest salary gap, at $44,263 per year
- About 41% of users apply to jobs above their salary expectations
- Project Managers have the highest salary gap from all job positions at $35,645
- Managing Directors are the only position offered a higher salary than their expectations
The following sections break down each finding individually.
The salary expectation gap in the United States has reached an alarming high. American job seekers expect an average salary of $143,041 , while employers are offering just $109,709. This is a gap of $33,332.
And this isn't just an American phenomenon, though the US leads the pack. In fact, JobLeads study found that 99% of all job applicants expect more than the market offers. For example, Canadian job seekers face a gap of -$21,907 (37,059 CAD), while Australians are looking at a difference surpassing -$14,803 (20,781 AUD). To clarify, a negative gap means workers expect more than employers offer.
The UK is an interesting outlier. There, average salary expectations are just $1,921 (£1,428) above offered wages. At the same time, British job seekers are also the most ambitious of all applicants, with 43% applying to positions above their expected salary range.
Interestingly, France stands out as the salary expectations fall significantly below what employers are actually offering–a gap of +$14,915 (€12,961). This could be because French workers often base their salary expectations on legally mandated minimum pay scales set by industry agreements rather than what the market is actually paying.
Combined with a cultural taboo around discussing salaries openly, many candidates may lack visibility into what employers are willing to pay, leading them to ask for less than the market would bear.
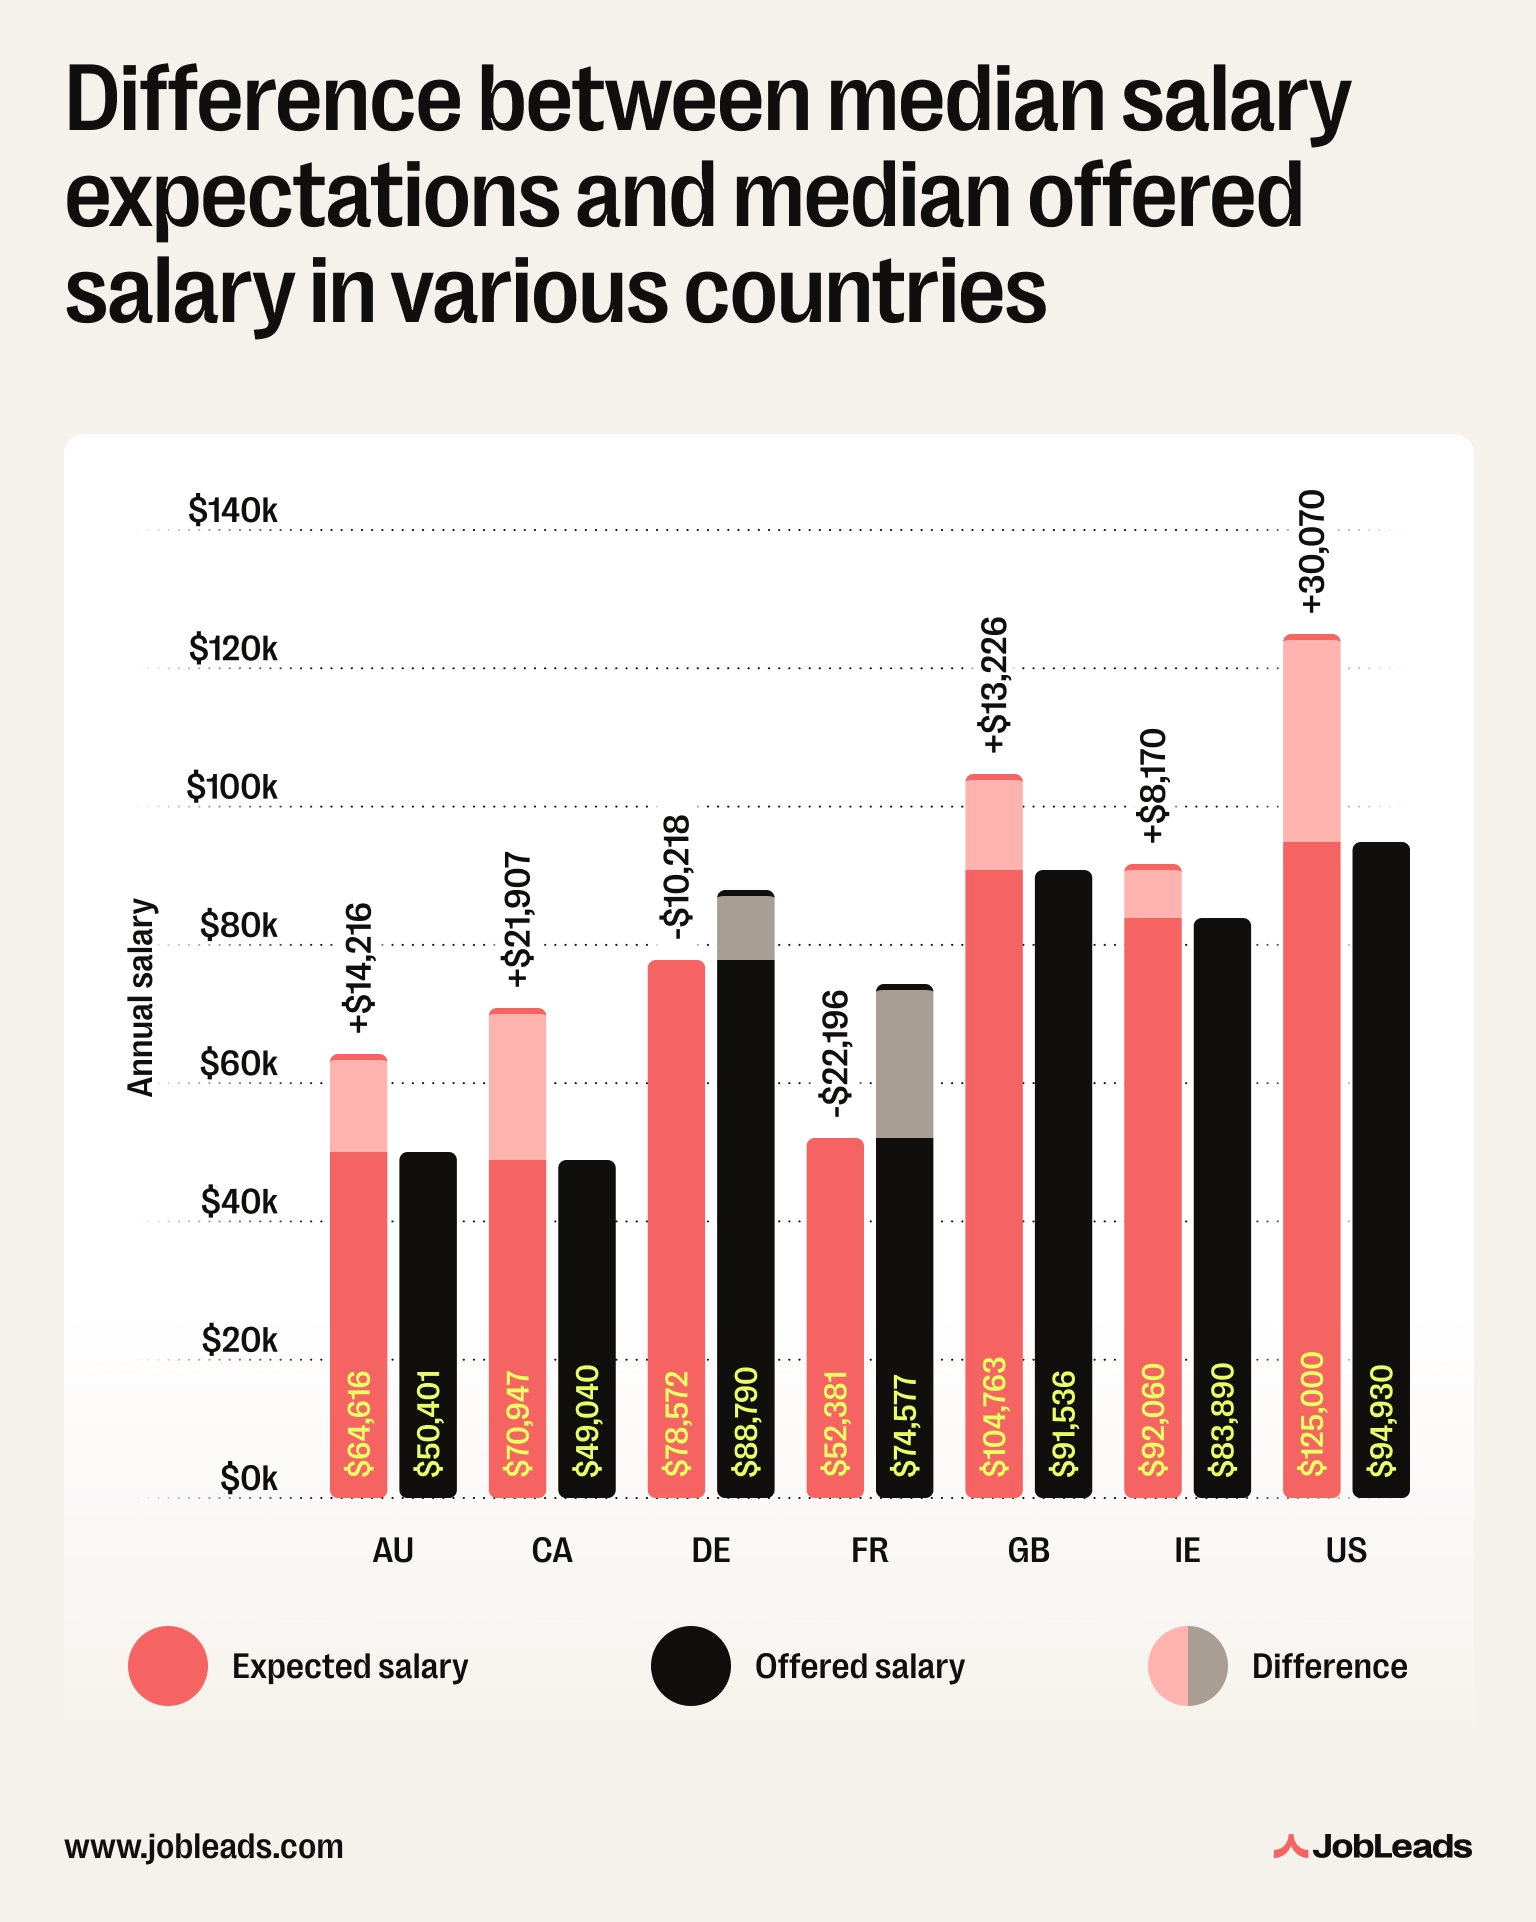
| Country | Median expected salary | Median offered salary | Difference |
|---|
| Australia | $64,616 | $50,401 | $14,216 |
| Canada | $70,947 | $49,040 | $21,907 |
| Germany | $78,572 | $88,790 | -$10,218 |
| France | $52,381 | $74,577 | -$22,196 |
| Great Britain | $104,763 | $91,536 | $13,226 |
| Ireland | $92,060 | $83,890 | $8,170 |
| United States | $125,000 | $94,930 | $30,070 |
Looking at the global gap, workers expect, on average, $94,078 and businesses offer salaries of $83,668. This suggests that the salary gap is widely dependent on the country as well as the industry you're in.
The average difference between expected and offered salaries ranges from -$33,482 to -$44,263 depending on the industry.
| Industry | Average salary | Average expectations | Expectation gap |
|---|
| Sales | $88,765 | $133,028 | -$44,263 |
| Management & Operations | $106,785 | $151,046 | -$44,261 |
| Human Resources | $90,725 | $133,322 | -$42,596 |
| Bio & Pharmacology & Health | $90,253 | $131,222 | -$40,969 |
| Engineering | $100,833 | $140,364 | -$39,531 |
| Marketing & Media | $97,310 | $135,439 | -$38,129 |
| IT & Technology | $116,721 | $154,658 | -$37,937 |
| Consulting | $118,679 | $156,453 | -$37,774 |
| Finance | $109,286 | $143,701 | -$34,415 |
| Legal | $105,799 | $139,281 | -$33,482 |
Sales has the highest discrepancy at -$44,263. Part of this comes down to how Sales compensation works. These roles often come with commission, bonuses, and performance incentives on top of a base salary. So, candidates may factor in strong earning potential when setting expectations, but employers advertise base pay, not on-target earnings.
There's nearly a dead heat with Management & Operations, which sits just $2 behind at -$44,261. Human Resources follows with a -$42,596 gap. In both cases, a big part of the problem is title ambiguity.
"Manager" can describe almost anyone, from a small team lead to a senior executive and candidates naturally tend to benchmark against the higher end of the scale. HR professionals face a particular irony where they often handle salary data for the rest of the business, yet still tend to overestimate what their own role commands on the open market.
test
On the other end of the spectrum, Legal registers the smallest gap across all industries at -$33,482, with Finance not far behind at -$34,415. While these figures are relatively more aligned, a gap of over $33,000 is still far from negligible.
| Position | Avg salary expectations vs avg salary offered |
|---|
| Managing Director | +$8,640 |
| Vice President | -$4,030 |
| Head of Department | -$27,269 |
| Specialist | -$29,996 |
| Team Leader | -$32,783 |
| Project Manager | -$35,645 |
Managing Director is the only position where reality actually exceeds expectations, with employers offering $8,640 more than candidates anticipate. Everyone else is reaching beyond what the market will bear.
Vice Presidents come closest to parity among the remaining roles, with a relatively modest gap of -$4,030. But when looking at other roles, the story doesn't look positive. In fact, Project Managers have the highest discrepancy between expected and offered salary at -$35,645/year. Team Leaders follow at -$32,783, with Specialists close behind at -$29,996.
Zooming into specific job roles, research, development and laboratory professionals experience the sharpest disconnect of all. They expect an average of $159,256 but are offered just $102,686/year, a gap of -$56,570. The difference is very similar for Controlling roles, where professionals expect $163,219 but receive $107,849 (a gap of -$55,370).
HR Strategy & Management roles as well as Business Engineering positions trail closely behind with gaps of -$50,635 and -$48,134 respectively. Among the roles listed, Operations & Business Administration shows the smallest–though still substantial–gap at -$45,013/year.
| Job title | Average salary offered | Average salary expected | Expectation gap |
|---|
| Research, development and laboratory | 102,686 | 159,256 | -$56,570 |
| Controlling | 107,849 | 163,219 | -$55,370 |
| HR Strategy & Management | 107,879 | 158,513 | -$50,635 |
| General HR | 77,689 | 126,527 | -$48,838 |
| Business Engineering & Management | 118,783 | 166,917 | -$48,134 |
| General Sales | 76,445 | 123,672 | -$47,226 |
| Business Intelligence & Analysis | 95,879 | 142,349 | -$46,470 |
| Project & Process Management | 102,212 | 148,525 | -$46,312 |
| Operations & Business Administration | 106,160 | 151,173 | -$45,013 |
| HR Services | 62,018 | 106,527 | -$44,509 |
When people sit down to search for their next job, they often have to state their salary range expectations very early in the process. That's when questions like "How much should I reach for?" and "How much am I willing to settle for?" come forth.
JobLeads data reveals that nearly half of job seekers (46%) play it safe and only apply for positions squarely within their stated salary expectations. But the other half feel more adventurous or maybe flexible with their demands.
Resume readiness is often part of the story here: job seekers who feel confident about their resume target roles paying $13K more than those who feel unprepared.
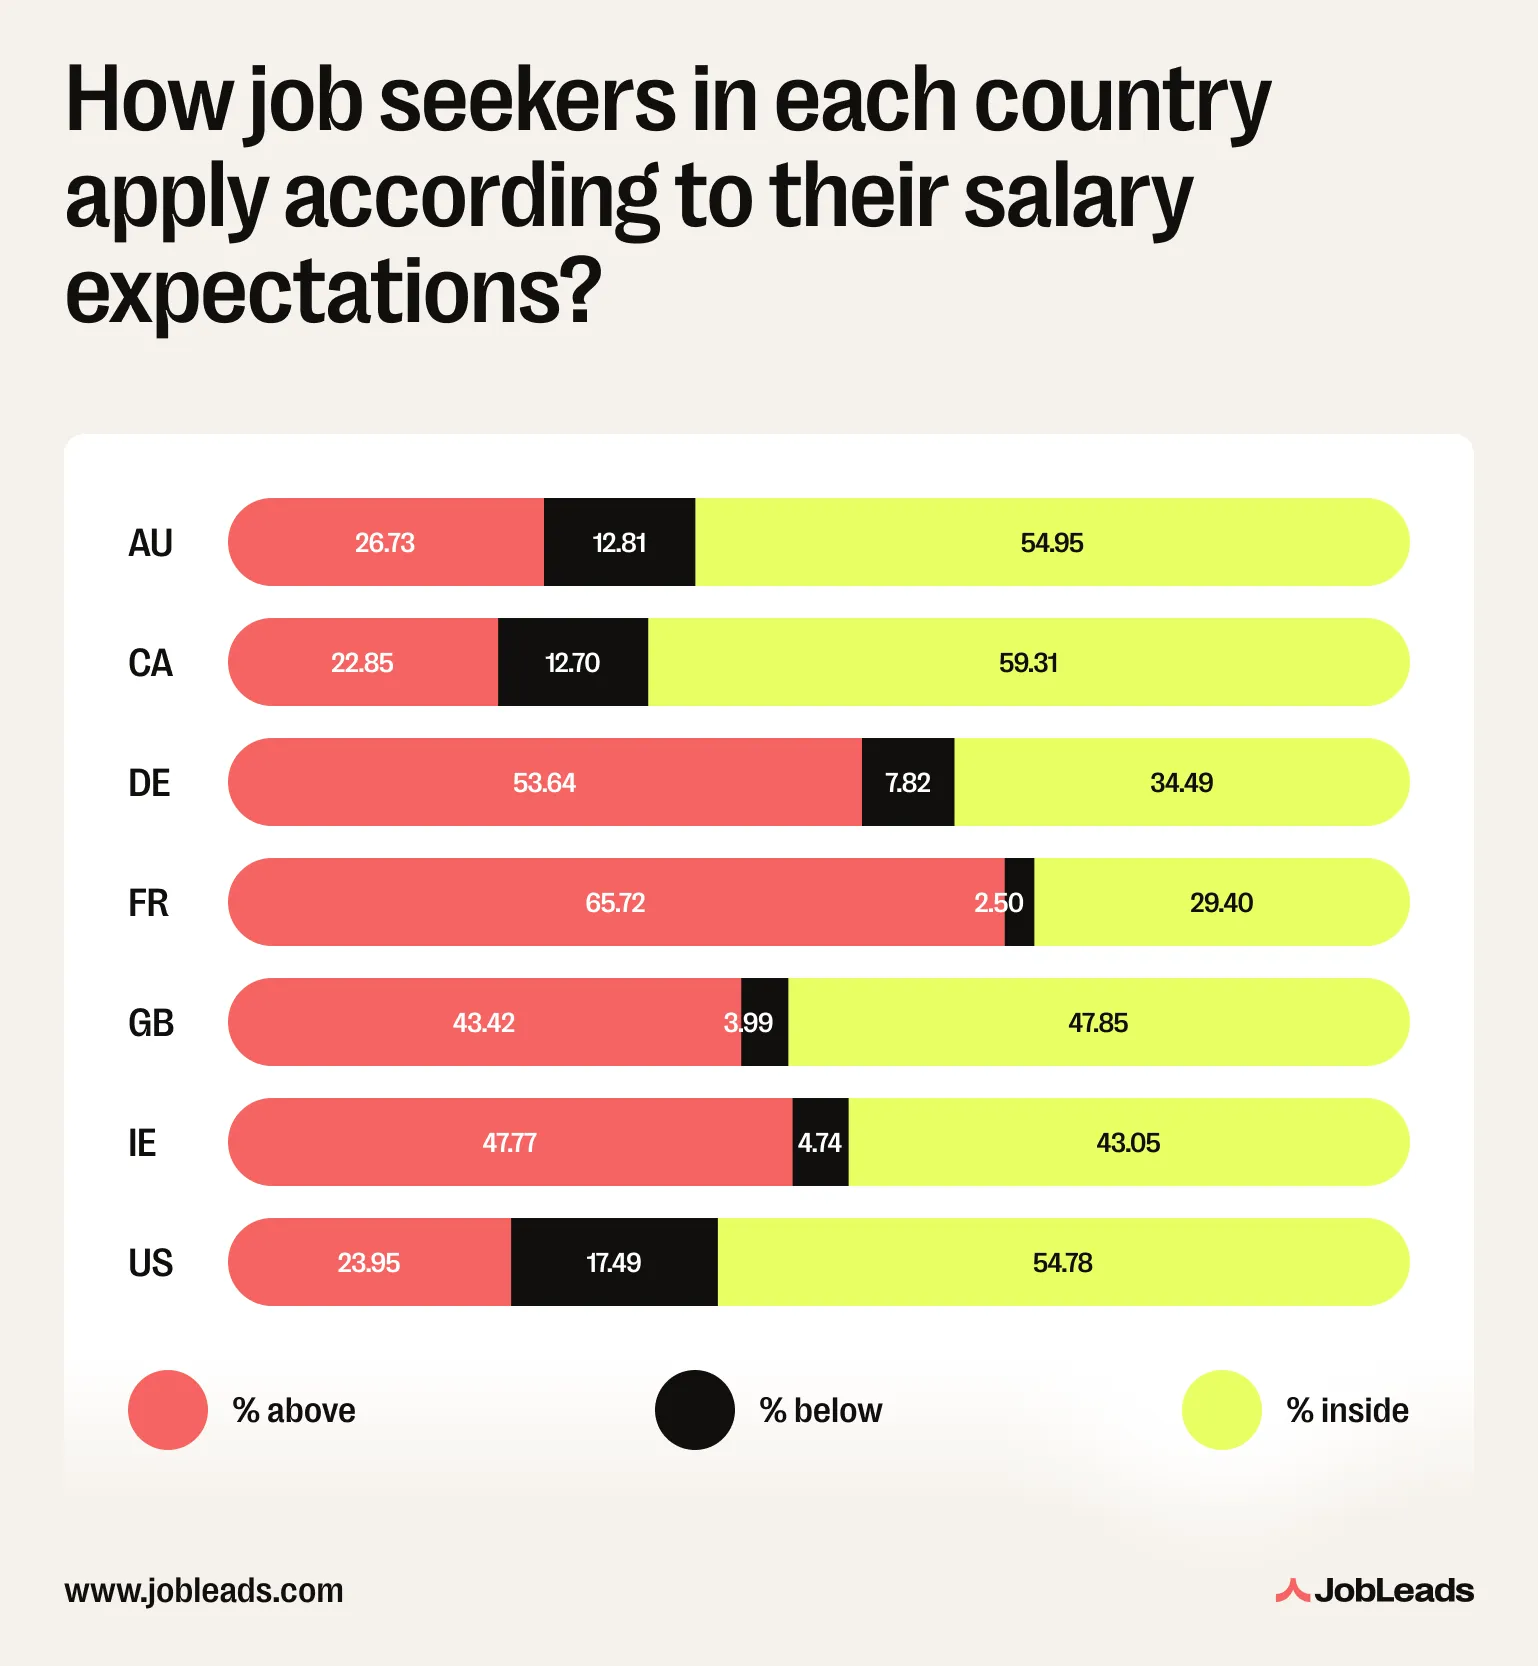
Four out of ten applicants shoot above their salary range, chasing positions that pay more than they initially said they wanted. It's a great strategic aspiration, as these job seekers understand that salary ranges are starting points, not ceilings. The right opportunity might be worth stretching for.
Interestingly, ambition varies by geography. In the UK, over 43% of people apply to jobs above their stated expectations, compared to only 24% in the US. Yet British job seekers aren't aiming wildly high. The average difference between expected and targeted salaries is a modest $1,900/year. They're not chasing pipe dreams, only testing the waters just beyond their comfort zone.
JobLeads' Talent Acquisition Manager explained that salaries in the UK tend to be more compressed than in the US, with pay bands that are tighter and more standardised. As a result, when a UK-based candidate applies above their expectations, the difference might only be a couple of thousands because the next band up simply isn't dramatically higher.
From my experience in both markets, US candidates tend to negotiate more aggressively. There's a culture of the 'big ask', aiming high and expecting pushback. British workplace culture is more reserved about discussing money, and asking for dramatically more than offered can feel presumptuous or even rude.
Nathan Putsey – Talent Acquisition Manager, JobLeads
But applying outside of your comfort zone mostly goes one way as just over 8% of people apply for positions below their expectations. This doesn't necessarily mean they've given up. These applicants likely spotted something valuable that transcends the paycheck. Maybe it's a foot in the door at a dream company or a role with a better work-life balance. Their applications tell us that base salary, despite its importance, isn't everything.
Their applications tell us that base salary, despite its importance, isn't everything. And this pattern isn't random as our research on the gender pay gap shows that men are significantly more likely to apply above their stated range.
Here's what's strange: a study by The Interview Guys shows that over 55% of professionals accept the first offer without negotiating. Yet, Pew Research Center found that two-thirds of those who do negotiate get what they ask for, with raises averaging 18% above initial offers. It's money left on the table.
And CareerBuilder research shows that employers aren't opposed. Over 70% actually expect you to negotiate. The disconnect isn't with hiring managers, but rather with candidates who don't realize the door is open.
The pressure on the other side of the table is real. A Robert Half study found that nearly three-quarters of hiring managers are worried they can't keep pace with compensation expectations. So they're adapting by stacking offers with new benefits and perks to compete. It can be considered a smart move as 53% of workers say they'd change jobs for better financial incentives, like bonuses or stock options, even if base pay didn't move.
Pay transparency laws are expanding across the US and Europe. Salary data has never been more accessible. Candidates know their worth. Employers know they'll be asked. The only thing that's hard to explain is why more than half still stay quiet.
Fear of the market, seniority concerns, lack of confidence–the reasons vary. But the data doesn't. Boldness pays.
Read more: JobLeads research on tech salaries on-site vs. remote found that a whopping 86% of roles pay more on-site than remotely.
Interestingly, over 70% of employers anticipate candidates to negotiate and 66% of negotiators successfully get what they ask for. This shows that silence is just leaving money on the table.
Now–
How to answer the salary expectations question?
When asked "What are your salary expectations?" deflect first and say "I'd love to learn more about the role's full scope and your budgeted range for this position." This prompts employers to reveal their range before you commit to a number. If pressed, provide a research-backed range instead of a single figure. This could sound like "Based on my research and experience, I'm targeting $X to $Y, though I'm open to discussing the total compensation package."
The antidote to this gap is information. When you know what companies actually pay, and not what you hope they'll pay, you negotiate from strength, not wishful thinking.
The candidate who names a number first almost always loses. Your goal in early conversations is to gather information and not give too much away.
Christy Morgan – Career coach, JobLeads
The salary expectations gap is not a mystery–it is a mismatch between what workers believe they are worth and what the market is currently offering. That gap is widest in Sales at over $44,263, narrowest in Legal at $33,482, and essentially flipped for Managing Directors, who are offered $8,640 more than they expect.
But here is the part that matters most: this gap does not have to cost you. Negotiation works–and most employers expect it. Yet a whopping 55% of professionals never ask.
The professionals who close the gap are not luckier. They are just asking.
Good news is that finding a job that meets your salary expectations doesn't have to be a guessing game. JobLeads connects you directly with headhunters and hiring managers who have positions matching your target compensation range. So why not try it out?
This study is based on two proprietary JobLeads data sources collected between July and December 2025:
- 811,000 active job postings across the United States (425,847), Australia (50,106), Canada (110,005), Great Britain (212,231), Germany (1,642), France (2,422), and Ireland (9,207)
- 245,000 user responses from JobLeads platform members in these five countries
For job title and position level analysis, we filtered for aggregated values surpassing 300 jobs to ensure statistical reliability. Data reflects actual hiring trends and jobseeker behavior within our platform during the second half of 2025. In this study, we used unweighted country averages.
Dataset limitations:
- This study draws exclusively from JobLeads platform data. This means the sample reflects users and job postings within our ecosystem and may not transfer to the broader labor market.
- The data only covers seven countries so findings cannot be interpreted fully globally.
- The six-month collection window captures a specific snapshot in time and may not be transferable to other periods of the year.
If our research helped you better understand the salary expectations gap, feel free to share any insights or statistics from this study. Please remember to credit JobLeads as the source and include a link back to this page. Thank you!



 Job Market Trends