Between October 2024 and March 2026, JobLeads recorded more than 28 million clicks across six countries (United States, United Kingdom, Canada, Australia, New Zealand, and Germany). The platform logged each click on a full-time vs part-time listing.
Part-time click share rose in every one of the six markets analyzed. In the US, it nearly tripled.
Over roughly that same period, a very different dataset moved the opposite way. Bankrate's side hustle survey found that only 27% of US adults had a side hustle in 2025, down from 36% in 2024, the lowest share since 2017. Fewer Americans say they're hustling on the side, while more of them are clicking on part-time job listings than ever before.
Both numbers are real. Neither is wrong. Put side by side, they force a distinction that headlines usually skip past: "part-time job" and "side hustle" are related, but they are not the same behavior. So, what's actually happening in the labor market?
Key takeaways
- The share of clicks on part-time jobs in the US tripled–from 5% of clicks in October 2024 to nearly 17% in March 2026
- New Zealand leads on part-time click share (25%); Germany trails at 11%, tied with the US
- Specialists are up to 9 times more likely than Vice Presidents to click a part-time listing
- Demand for part-time work outpaces supply–the gap is widest in Australia (27% demand vs 17% supply) and nearly flat in the US (16% demand vs 15% supply)
- Side hustle participation among US adults fell to 27% in 2025, down from 36% in 2024 (Bankrate)
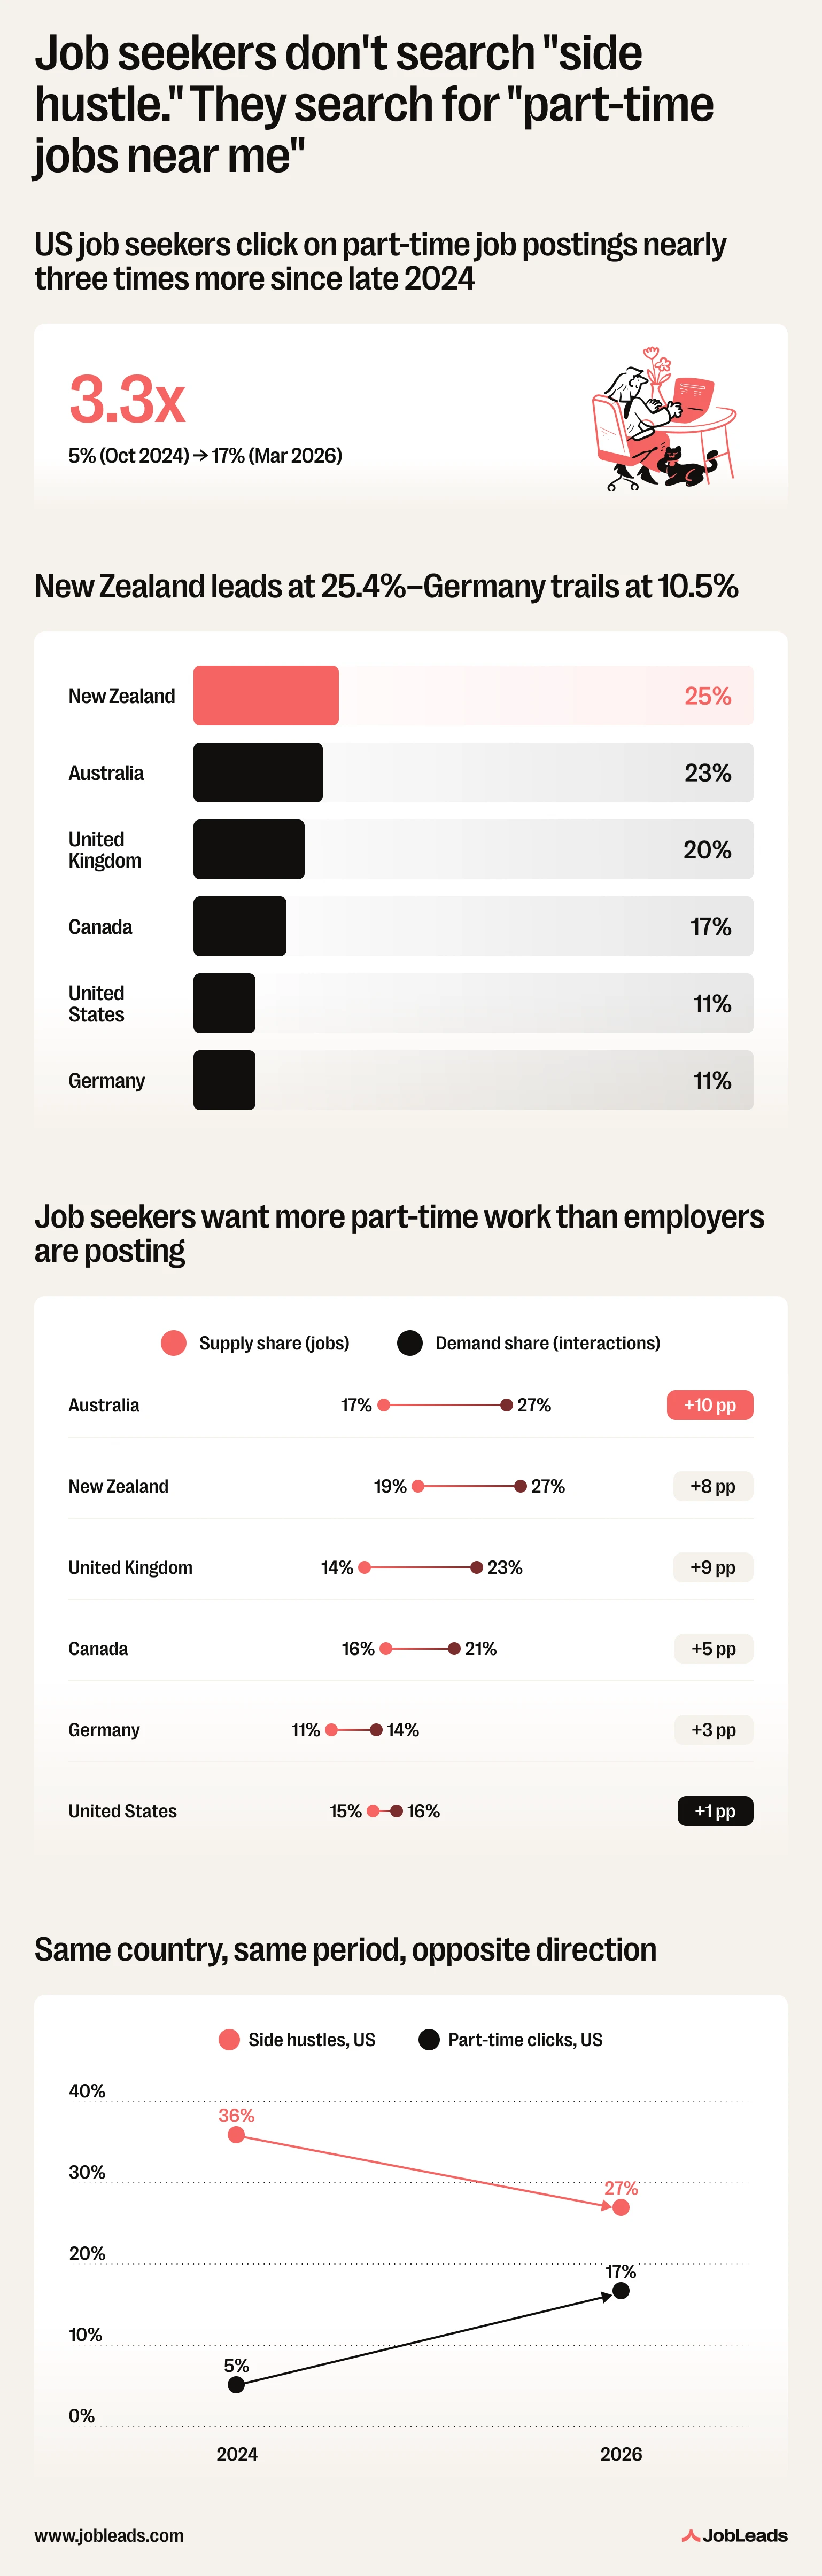
The clearest trend in the data is direction: part-time click share climbed in all six markets between October 2024 and March 2026, with no reversal in any country over the full window studied. The size of the climb, though, varies sharply.
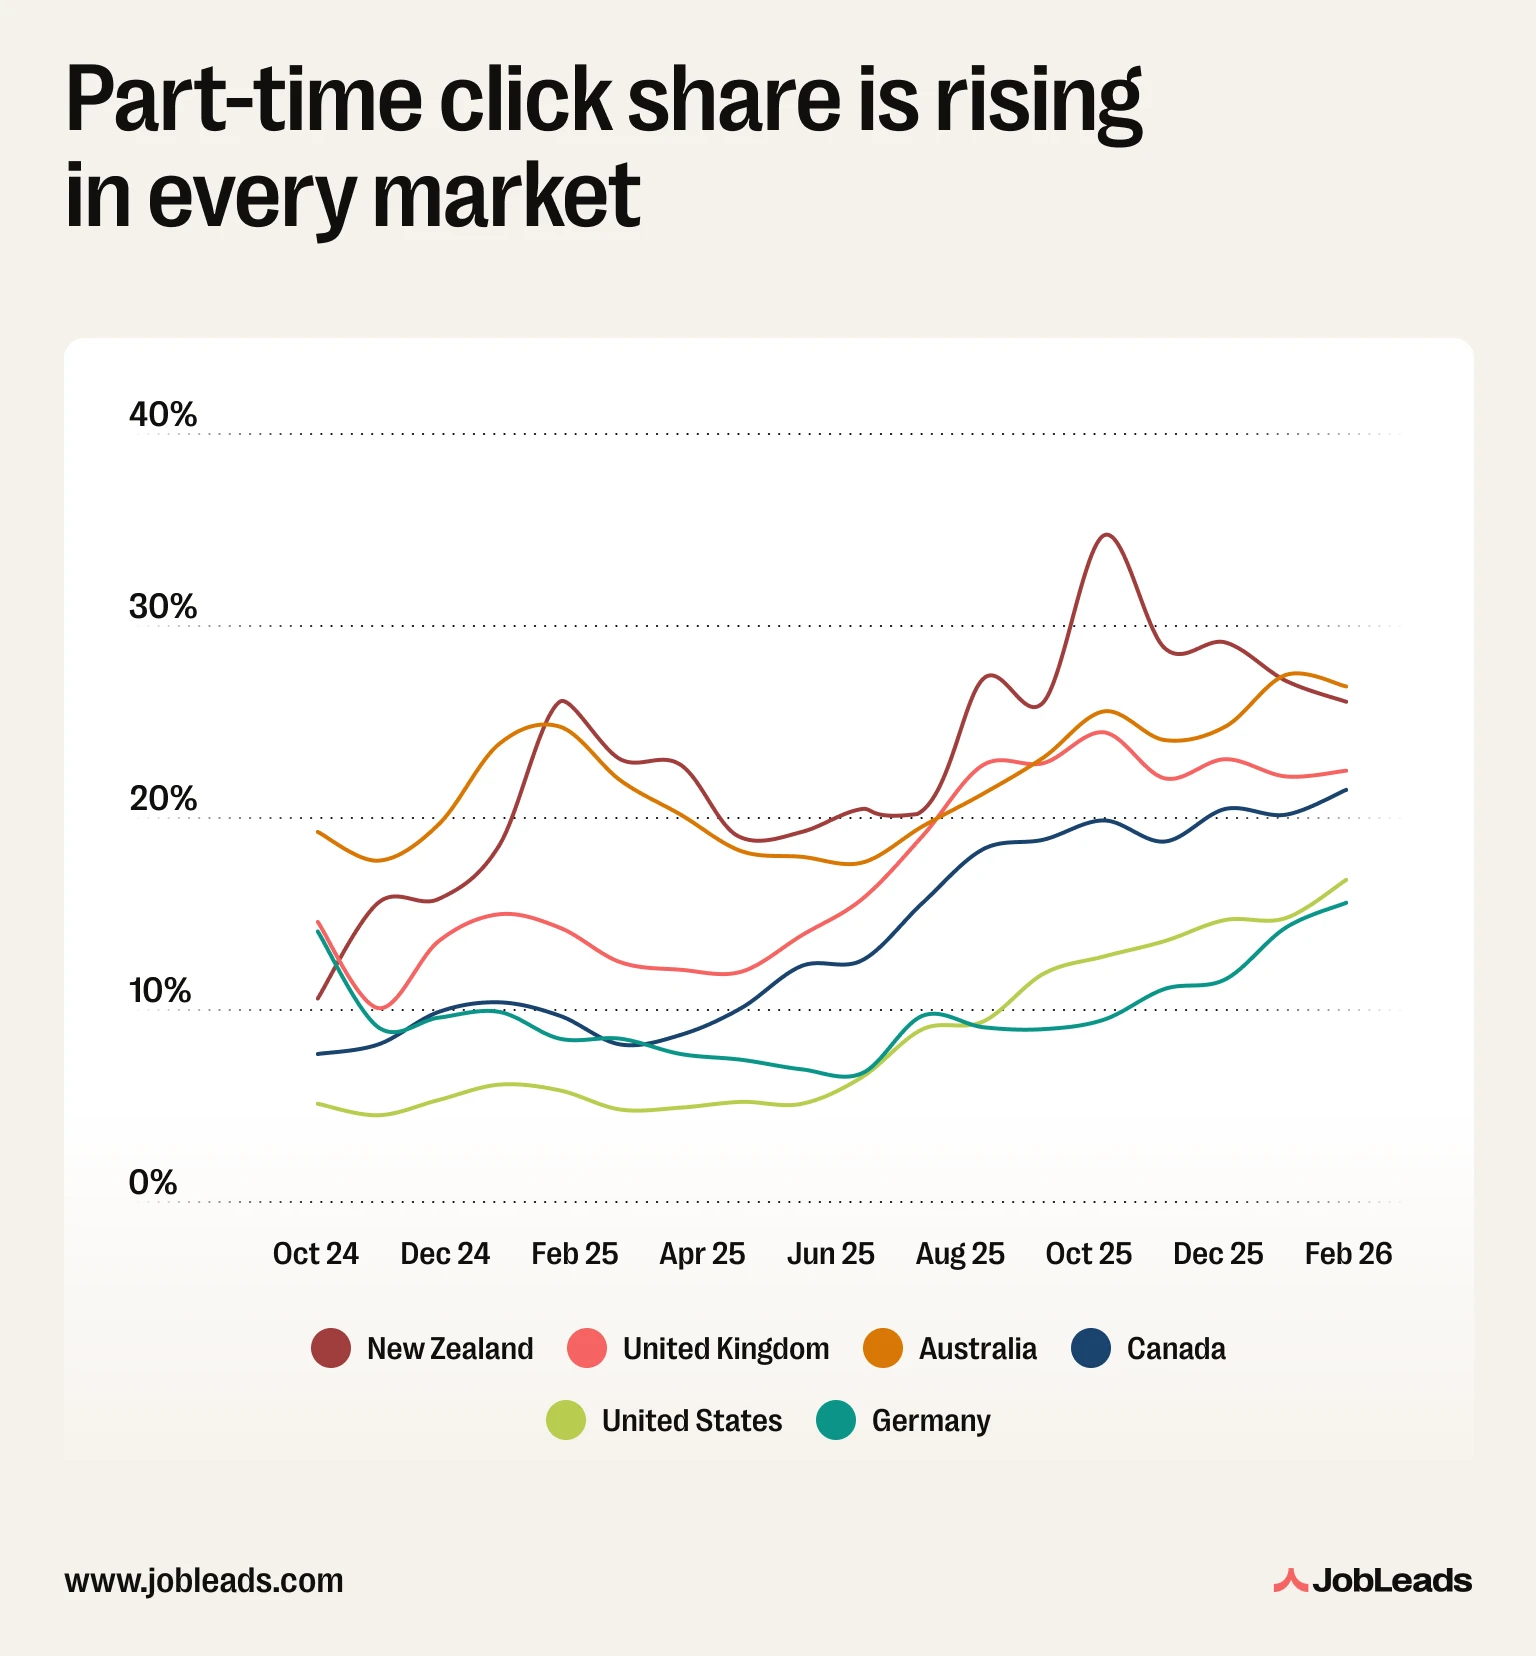
The US moved from 5% to nearly 17%–a 3.3x increase. This is the largest relative jump in the dataset. Canada moved from 8% to 21% (2.8x), and New Zealand from 11% to 26% (2.5x). New Zealand is also the most volatile country in the dataset, spiking to 35% in November 2025 before settling back to around 26% by March 2026.
Australia has been the steadiest recently, holding between 24% and 27% since November 2025. Germany has the smallest net rise of the six. It started and ended in almost the same place (14% → 15.6%, +1.6 percentage points), after dipping to around 7% in mid-2025 and recovering through early 2026. By March 2026, it was the lowest of the six markets.
Two different growth stories are happening in this data at once: the US and Canada are catching up from a low base, while New Zealand and Australia are compounding gains on top of an already-elevated starting point.
Looking at the most recent rolling 12 months (April 2025 to March 2026) rather than the full trend line, a clear two-tier split emerges.
| Country | Part-time jobs click share |
|---|
| New Zealand | 25.4% |
| Australia | 22.8% |
| United Kingdom | 19.8% |
| Canada | 16.6% |
| United States | 11.1% |
| Germany | 10.5% |
New Zealand, Australia, the UK, and Canada cluster in a 17%-25% band. The US and Germany sit together, apart from the rest, at 11%.
These are 12-month averages, so they sit below the March 2026 figures above: the US averaged 11% across the year but ended it at nearly 17%.
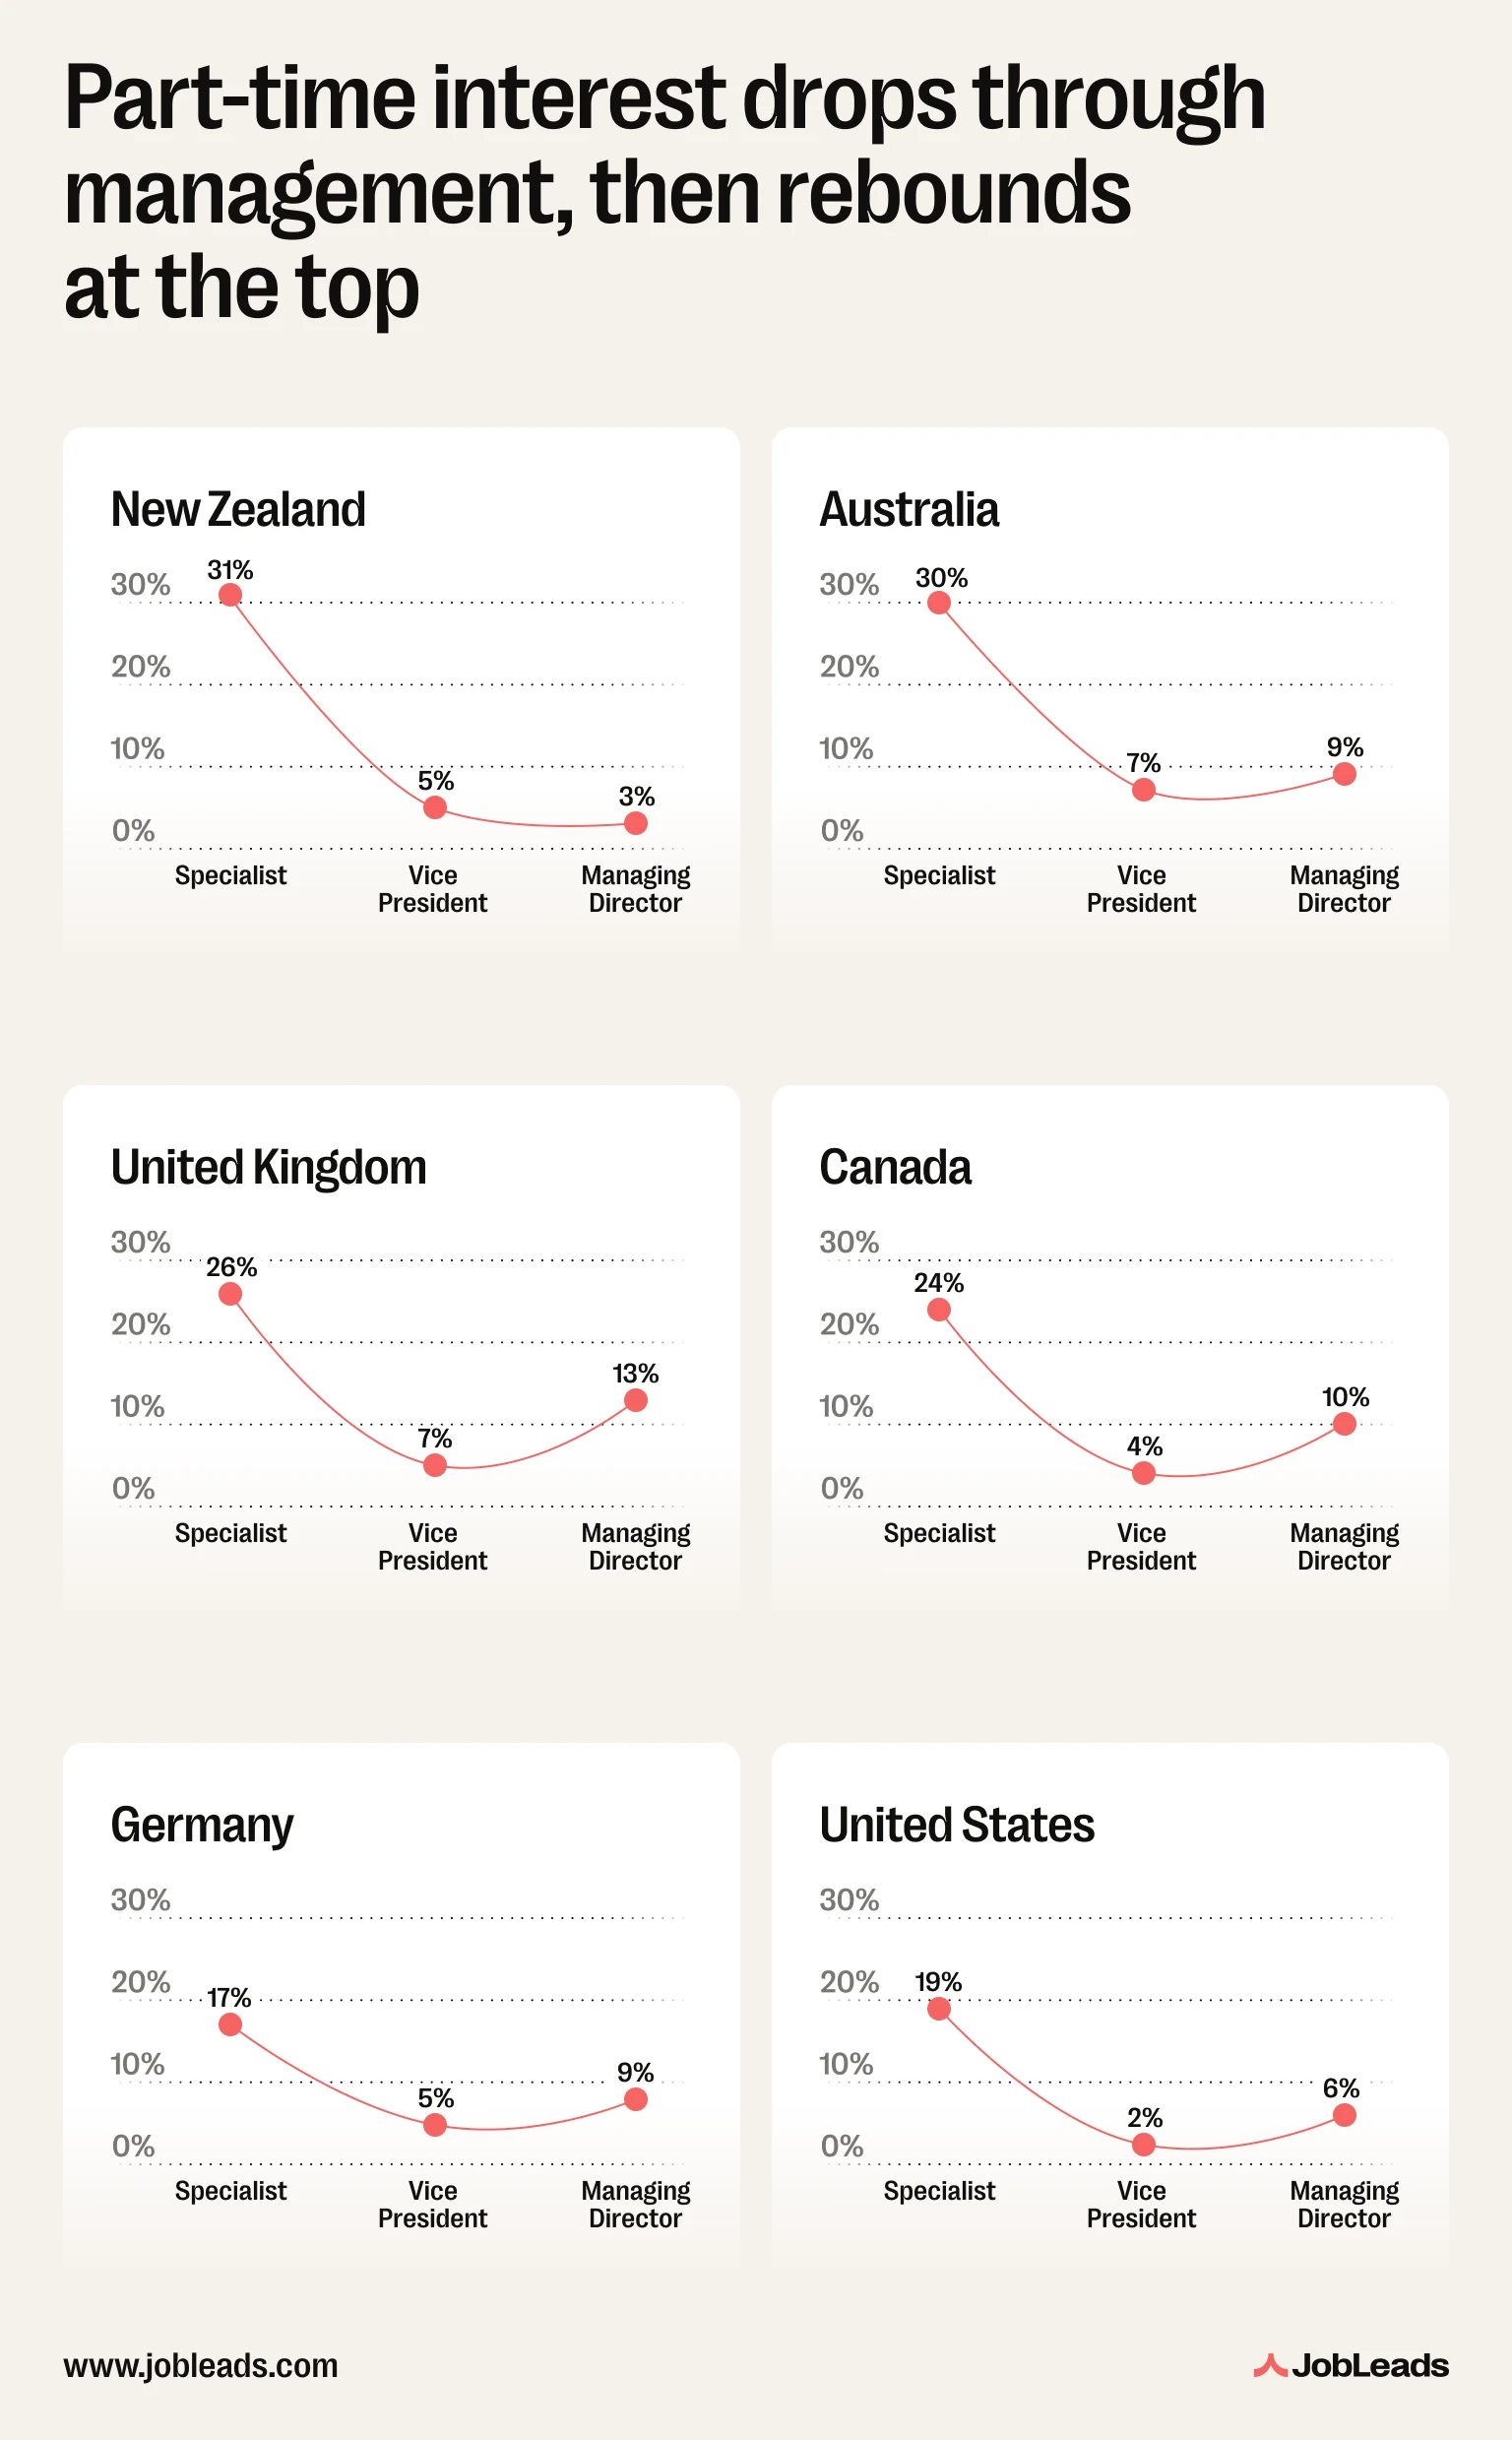
Part-time interest is not evenly spread across seniority. Using JobLeads' Q1 2026 interaction data–28.6 million views, saves, and apply-clicks across the six markets–the pattern by seniority holds in five of the six markets. It's high at Specialist level, dropping through Project Manager, bottoming out around Vice President, then partially recovering at Managing Director.
Here’s the share of each seniority level’s interactions that land on part-time job postings:
| Country | Specialist | Vice President | Managing Director |
|---|
| New Zealand | 30.7% | 5.3% | 3.3% |
| Australia | 30.4% | 6.7% | 8.6% |
| United Kingdom | 25.7% | 7.4% | 13% |
| Canada | 23.5% | 4% | 10.4% |
| Germany | 17.2% | 4.7% | 9.1% |
| United States | 19% | 2.1% | 6.5% |
The Specialist-to-VP gap ranges from 3.5x (UK) to 9.1x (the US). This means that a Specialist in the US is over nine times more likely than a VP to click a part-time listing. But then it raises again at the Managing Director's stage.
The Managing Director rebound holds in five of the six markets, most pronounced in the UK (13%, nearly double the VP rate) and Canada (10%, more than double the VP rate). New Zealand is the one exception: its MD rate (3%) sits below its VP rate (5%), the only market where the U-shape doesn't fully close at the top.
The share of JobLeads clicks going to part-time roles has been rising in every one of the six markets since late 2024. Underneath the country ranking, one behavioral pattern holds in five of the six markets: part-time engagement peaks with Specialists, drops through mid-management, and bumps back up at Managing Director level.
Ricardo Meneses – Data Analyst, JobLeads
The Managing Director bump is worth sitting with, though the data can't say who's behind it–only seniority tier and click behavior, not job title or motive. One plausible read is the rise of fractional and portfolio-style senior roles, where MDs take on part-time, project-based work instead of a full-time chair.
That's an interpretation, not something this dataset confirms. What's clear is that Specialist- and MD-level interest in part-time work are two distinct spikes, for reasons this data alone can't separate.
A separate question sits underneath the ranking: is the appetite for part-time work outrunning the actual supply of part-time jobs? Comparing Q1 2026 active-job composition (supply) against Q1 2026 interaction share (demand) gives a direct answer.
This section uses Q1 2026 interaction data (views, saves, and apply-clicks) rather than clicks, so the shares differ slightly from the ranking above.
Here's the share of active part-time jobs vs how many interactions they get:
| Country | Supply (share of active part-time jobs) | Demand (share of interactions) | Gap |
|---|
| Australia | 17% | 26.5% | +9.5 pp |
| New Zealand | 18.6% | 27.3% | +8.7 pp |
| United Kingdom | 13.9% | 22.5% | +8.6 pp |
| Canada | 15.8% | 20.6% | +4.8 pp |
| Germany | 11.3% | 13.9% | +2.6 pp |
| United States | 14.7% | 15.5% | +0.8 pp |
In every market, demand for part-time jobs exceeds supply–job seekers are selecting part-time listings out of the mix at a higher rate than the availability of those listings would predict.
Australia's gap (+10 points) is the widest: part-time makes up 17% of active listings but pulls in 27% of engagement. The US is the outlier at the other end–a 1-point gap means that American job seekers engage with part-time roles in almost exactly the proportion the market offers them.
Here is where the two datasets that opened this article actually meet.
Bankrate's annual survey found side hustle participation among US adults fell to 27% in 2025, from 36% in 2024–the lowest level since 2017. The decline is attributed to a cooling labor market.
Meanwhile, the US Bureau of Labor Statistics reports that the number of people working part-time for economic reasons–because they couldn't find full-time work–held roughly flat at 4.5-4.8 million people throughout 2026. Neither the survey data nor the official labor statistics show a part-time or side-hustle boom in the underlying US labor market.
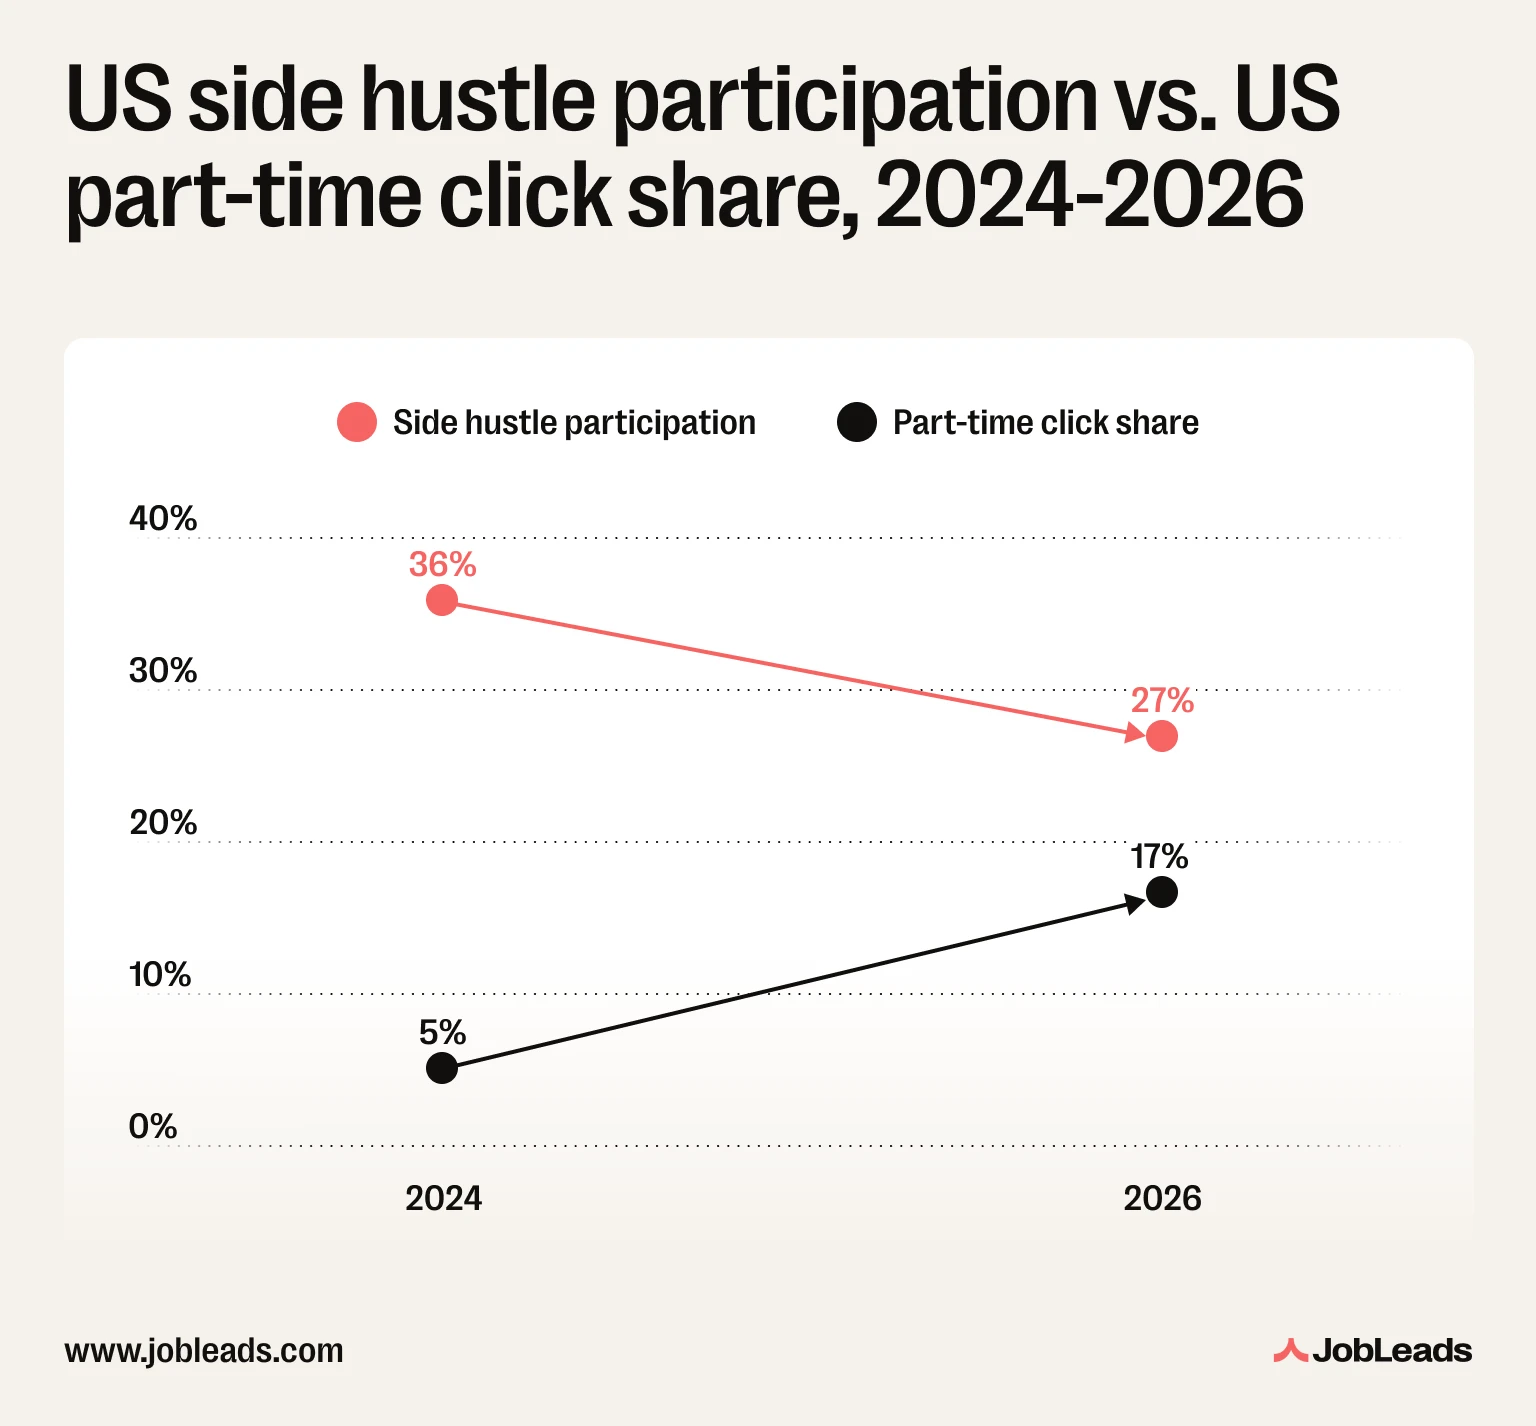
Yet JobLeads' US part-time click share tripled over almost the same window.
The reconciliation is a scope difference rather than a contradiction. Bankrate is measuring self-reported informal income activity: freelancing, reselling, driving, tutoring, anything outside a main job. The BLS figure is measuring involuntary part-time employment specific to people who couldn't get full-time hours.
On the other hand, JobLeads' data measures click interest in structurally part-time job listings on a career-search platform–postings with contract_type coded as part-time, not gig-app shifts or freelance income.
The side hustle culture is shrinking. The part-time job search is not. Both statements are true, and the reason is that "side hustle" and "part-time job" were never measuring the same population to begin with.
Two main things follow from this data.
First, the Managing Director rebound suggests part-time work isn't only an early-career or student pattern. It shows up again, differently, for people likely running their own business or consulting on the side, so age or seniority alone shouldn't rule someone out of looking.
Second, in most markets outside the US, part-time demand is genuinely outrunning supply. This is worth knowing before assuming part-time roles are easy to find; in the US alone, supply and demand are roughly in balance.
If you're searching for a part-time job, check out vetted listings on JobLeads.
This analysis draws on two internal JobLeads datasets and three external benchmarks–clearly labeled and shown for contrast only, not merged into any JobLeads figure.
JobLeads platform data: more than 28 million coded click events–clicks on jobs whose contract_type was structured as full-time or part-time–collected between October 2024 and March 2026 across six markets (United States, United Kingdom, Canada, Australia, New Zealand, Germany). These six markets were selected as JobLeads' primary English-speaking and DACH markets, chosen for having sufficient platform click volume to support reliable month-by-month analysis over the full period studied.
The trend analysis covers the full 18-month window; the country ranking covers the rolling 12 months from April 2025 to March 2026, chosen for stable comparison volume.
The seniority and supply/demand breakdowns draw on a separate Q1 2026 dataset of 28.6 million user-job interaction events (views, saves, and apply-clicks) plus a Q1 2026 active-jobs dataset.
Because the analysis uses three different time windows and measures, the same country can show different figures. For example, the US part-time share is 16.8% in March 2026 (monthly click share, trend section), 11.1% across April 2025–March 2026 (12-month click share, country ranking), and 15.5% in Q1 2026 (share of interactions, supply/demand section). All three are correct for their own window and measure.
Roughly 3% of clicks/interactions on jobs with no structured contract_type were excluded from every denominator. A job is classified part-time if it was ever flagged part-time in JobLeads' systems during the time window analyzed.
External benchmarks: Bankrate's 2025 side hustle survey (self-reported US adult survey data) and the US Bureau of Labor Statistics' Employment Situation report, July 2026 (part-time-for-economic-reasons).
Limitations:
- JobLeads click and interaction data measures interest and behavior on the JobLeads platform, not confirmed employment, hours actually worked, or income–there is no earnings data behind any figure in this article
- This is not a measure of the full labor market or the informal, app-based gig economy (Uber, Instacart, Fiverr); JobLeads is a career-search platform, and this data reflects engagement with structured part-time job listings only
- Pre-October 2024 click volume was too sparse (under 5,000 clicks per country per month) for reliable monthly shares, which is why the trend series starts in October 2024.
- All data is aggregated and anonymized; no individual user is identifiable anywhere in this article.
Journalists and media organizations are welcome to reproduce charts and data from this article with attribution to JobLeads and a link to this page. Please do not reproduce the article in full without permission. For questions, additional data, or interview requests, contact press@jobleads.com.



 Job Market Trends