
 Job Market Trends
October 02, 2026
The Best Cities for Young Professionals [US Ranking]
JobLeads ranked the 50 biggest US cities for graduates by what's left after rent, not headline pay. See where a starting salary stretches furthest.


The United States spent 2026 making itself harder to get into. The challenges for job seekers include a proposed fee of more than $100,000 on new H-1B petitions, a sudden freeze on green-card filings at some of the largest employers, and a proposal to scrap the grace period that lets laid-off visa holders stay and look for work.
Every one of those fights is mostly about the same person: the foreign tech worker.
But is that who is actually trying to get in?
To find out, JobLeads analyzed how job seekers in 41 countries searched for work in the United States–133,635 people, and 137,691 clicks and applications on US jobs between May and September 2026.
The H-1B is the main US work visa for what the law calls specialty occupations: jobs needing at least a bachelor's degree in a specific field. An employer has to sponsor it, and it ties the worker to that employer and that worksite. Congress caps it at 85,000 a year–65,000 places plus 20,000 reserved for people holding a US master's degree.
Until the 2027 lottery, those places were drawn at random but now they are weighted towards higher-paying jobs. And, in practice, the H-1B program is a tech program. Computer-related occupations took 62% of all approvals in 2025, systems analysis and programming alone took 50%, and 70% of approved workers were born in India. When American politicians argue about H-1B, they are essentially arguing about software engineers.
When ranking the 41 countries analyzed by how many people search for US jobs, the United Kingdom comes first: 14% of all US-bound searchers in the study are in the UK.
But, rank the countries by who actually clicks on or applies to a US job after searching for one, and the UK drops to sixth. Chile falls further–third by searching, 27th by acting. Only 4% of Chilean searchers clicked on or applied to a US job.
Now run the list the other way. India is fifth by searchers and first by the number of people who go on to click or apply. Pakistan is eleventh by searchers and third by that count.
Ranked by conversion rate the order changes again: Pakistan leads at 58%, then Turkey at 54% and India at 53%, from just 0.6% of all US-bound searchers in Turkey's case. Indonesia reaches 52%, the Philippines 49%, Venezuela 48%. Across all 41 countries, 20% of people who searched for a US job went on to click on or apply to one.
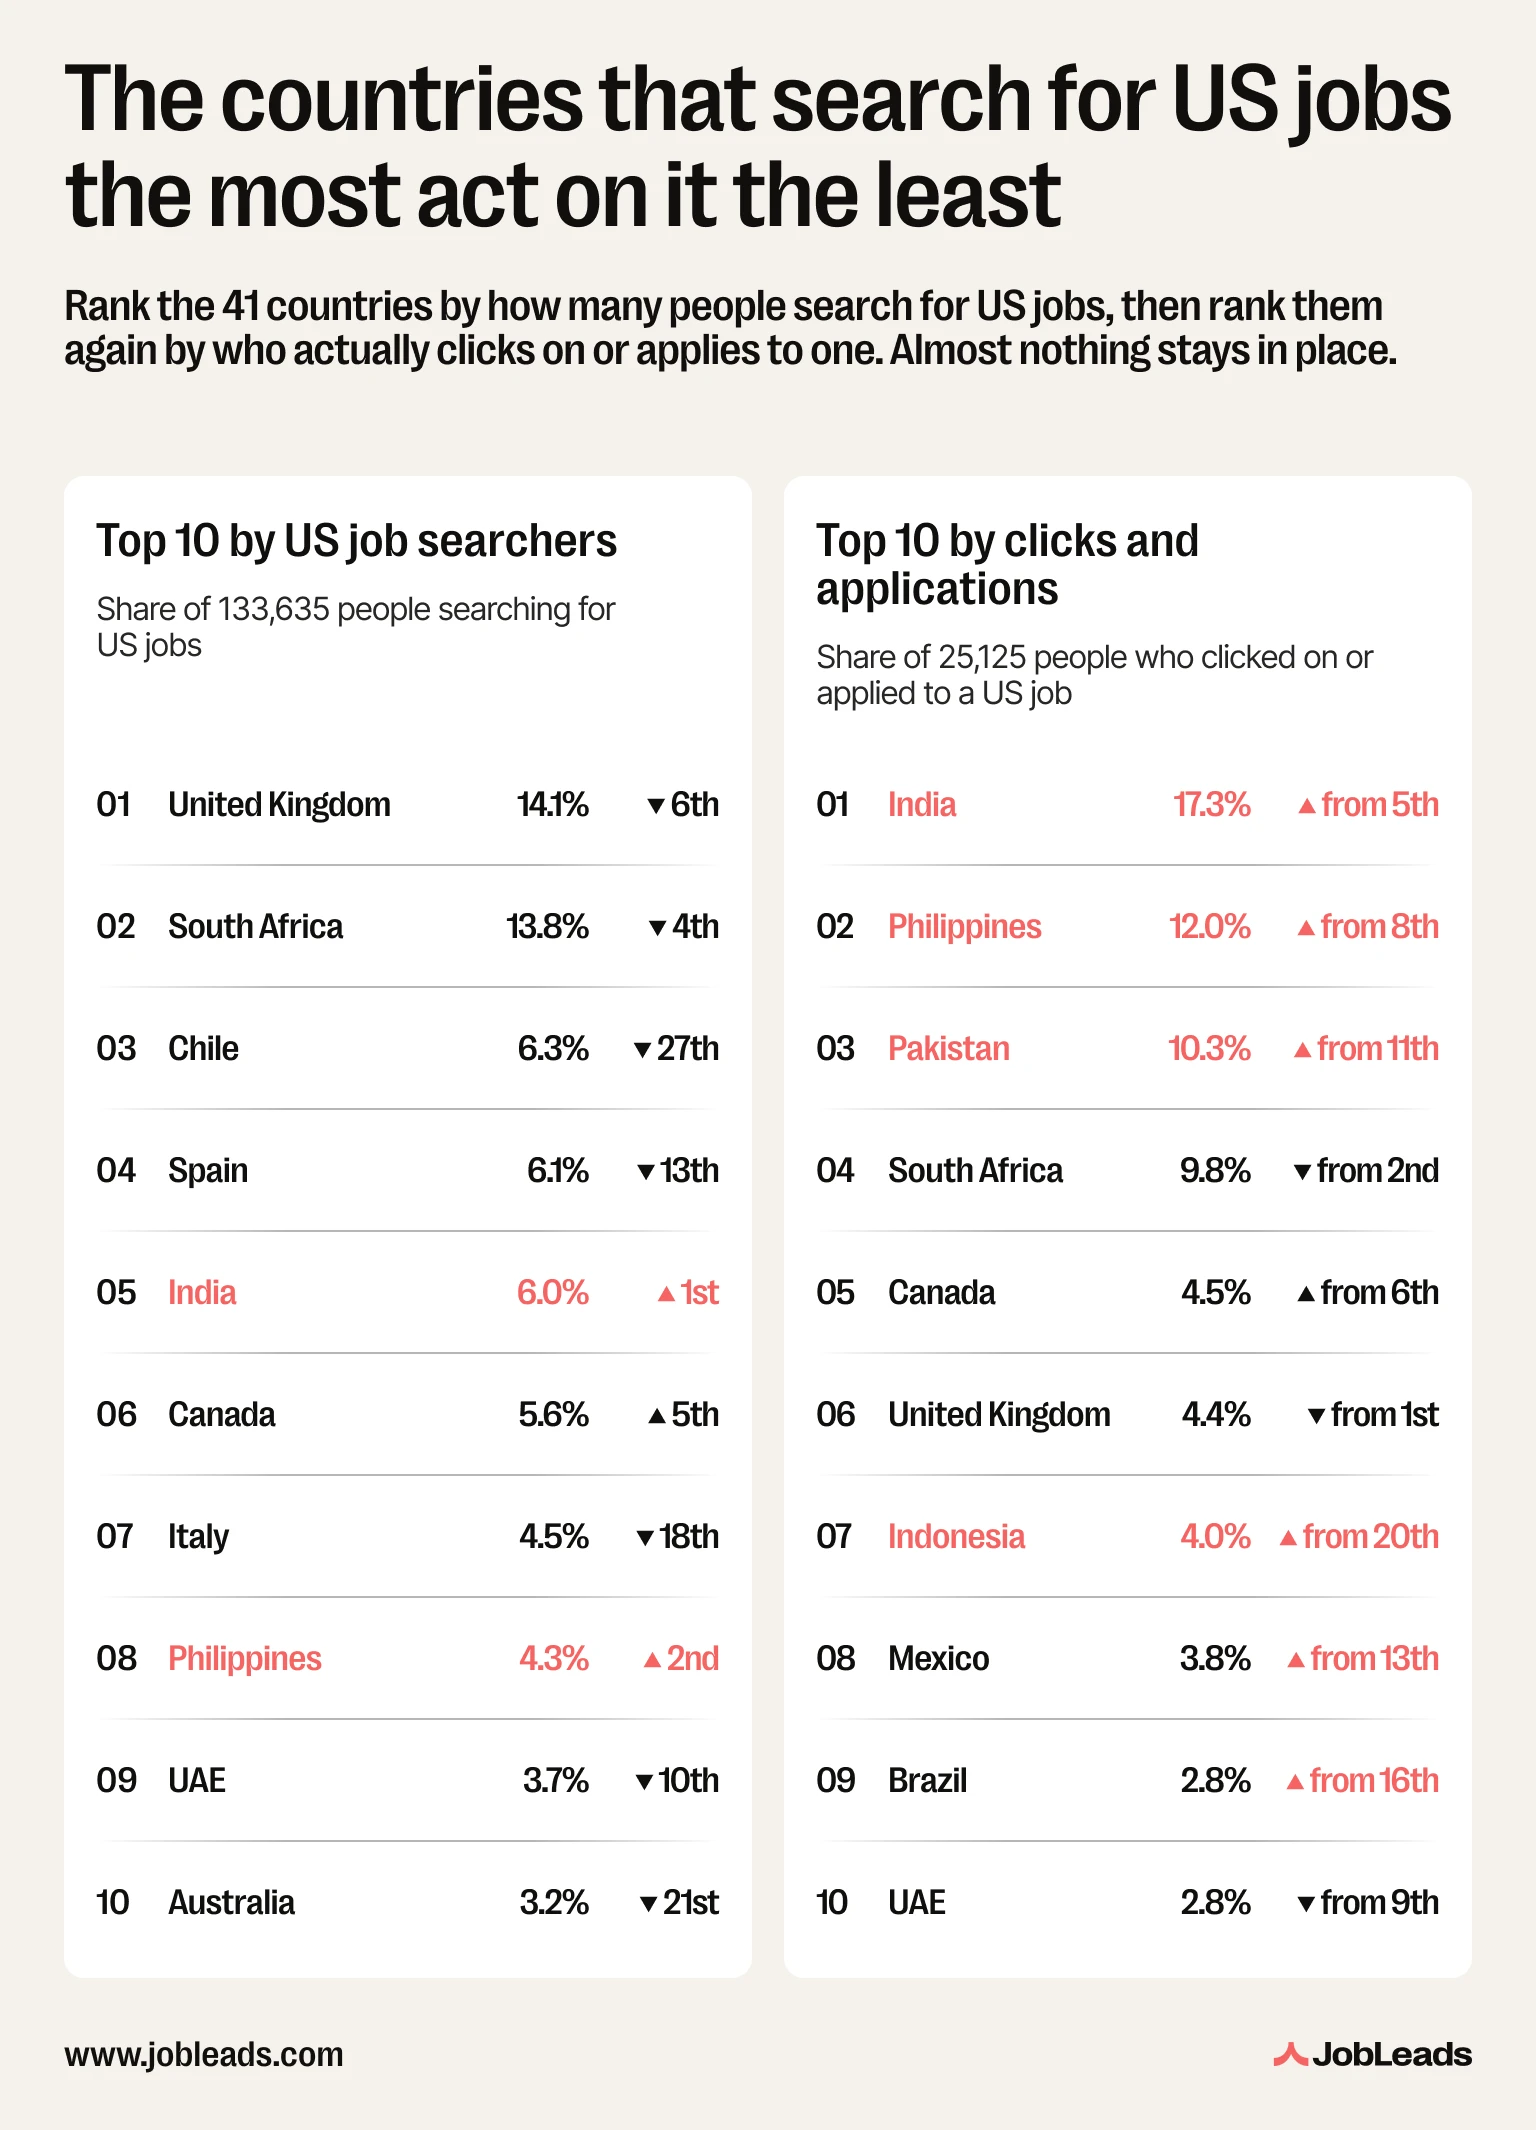
People in Pakistan ran an average of 4.4 US job searches each and people in India 3.4, against 1.9 in the UK and 1.8 in Australia. The result is a queue that looks nothing like the search traffic feeding it: India, the Philippines, Pakistan and South Africa together account for 49% of everyone who clicked on or applied to a US job, while the UK accounts for 4.4% and Chile for 0.7%.
Most US job ads don't say what they pay, and that is the first thing to know about this figure: only 26% of the clicks international job seekers made on US jobs landed on an ad stating a salary. About 88% of the people who clicked looked at at least one job that named no pay at all.
Among the jobs that did state a figure, the distribution is bottom-heavy. Around 35% of interaction went to jobs paying under $60,000 a year, 13.5% to jobs paying $60,000-80,000, and almost 11% to jobs paying $80,000-100,000, which is 59% below $100,000 in total. Only 10.5% went to jobs paying $150,000-200,000 and 10.3% to jobs paying more than $200,000.
Read more: A six-figure salary job is a goal for many. Check out JobLeads' research on where these concentrate.
The pattern varies by country in the direction one would expect. For example, in the Philippines, 29% of job seekers clicked on a job paying under $60,000, the highest share anywhere. At the same time, in Canada, 12% looked at jobs paying $150,000-200,000 and 9% at jobs paying more than $200,000. Germany is the other outlier at the top, with 16% looking at the $100,000-150,000 band and 12% above it.
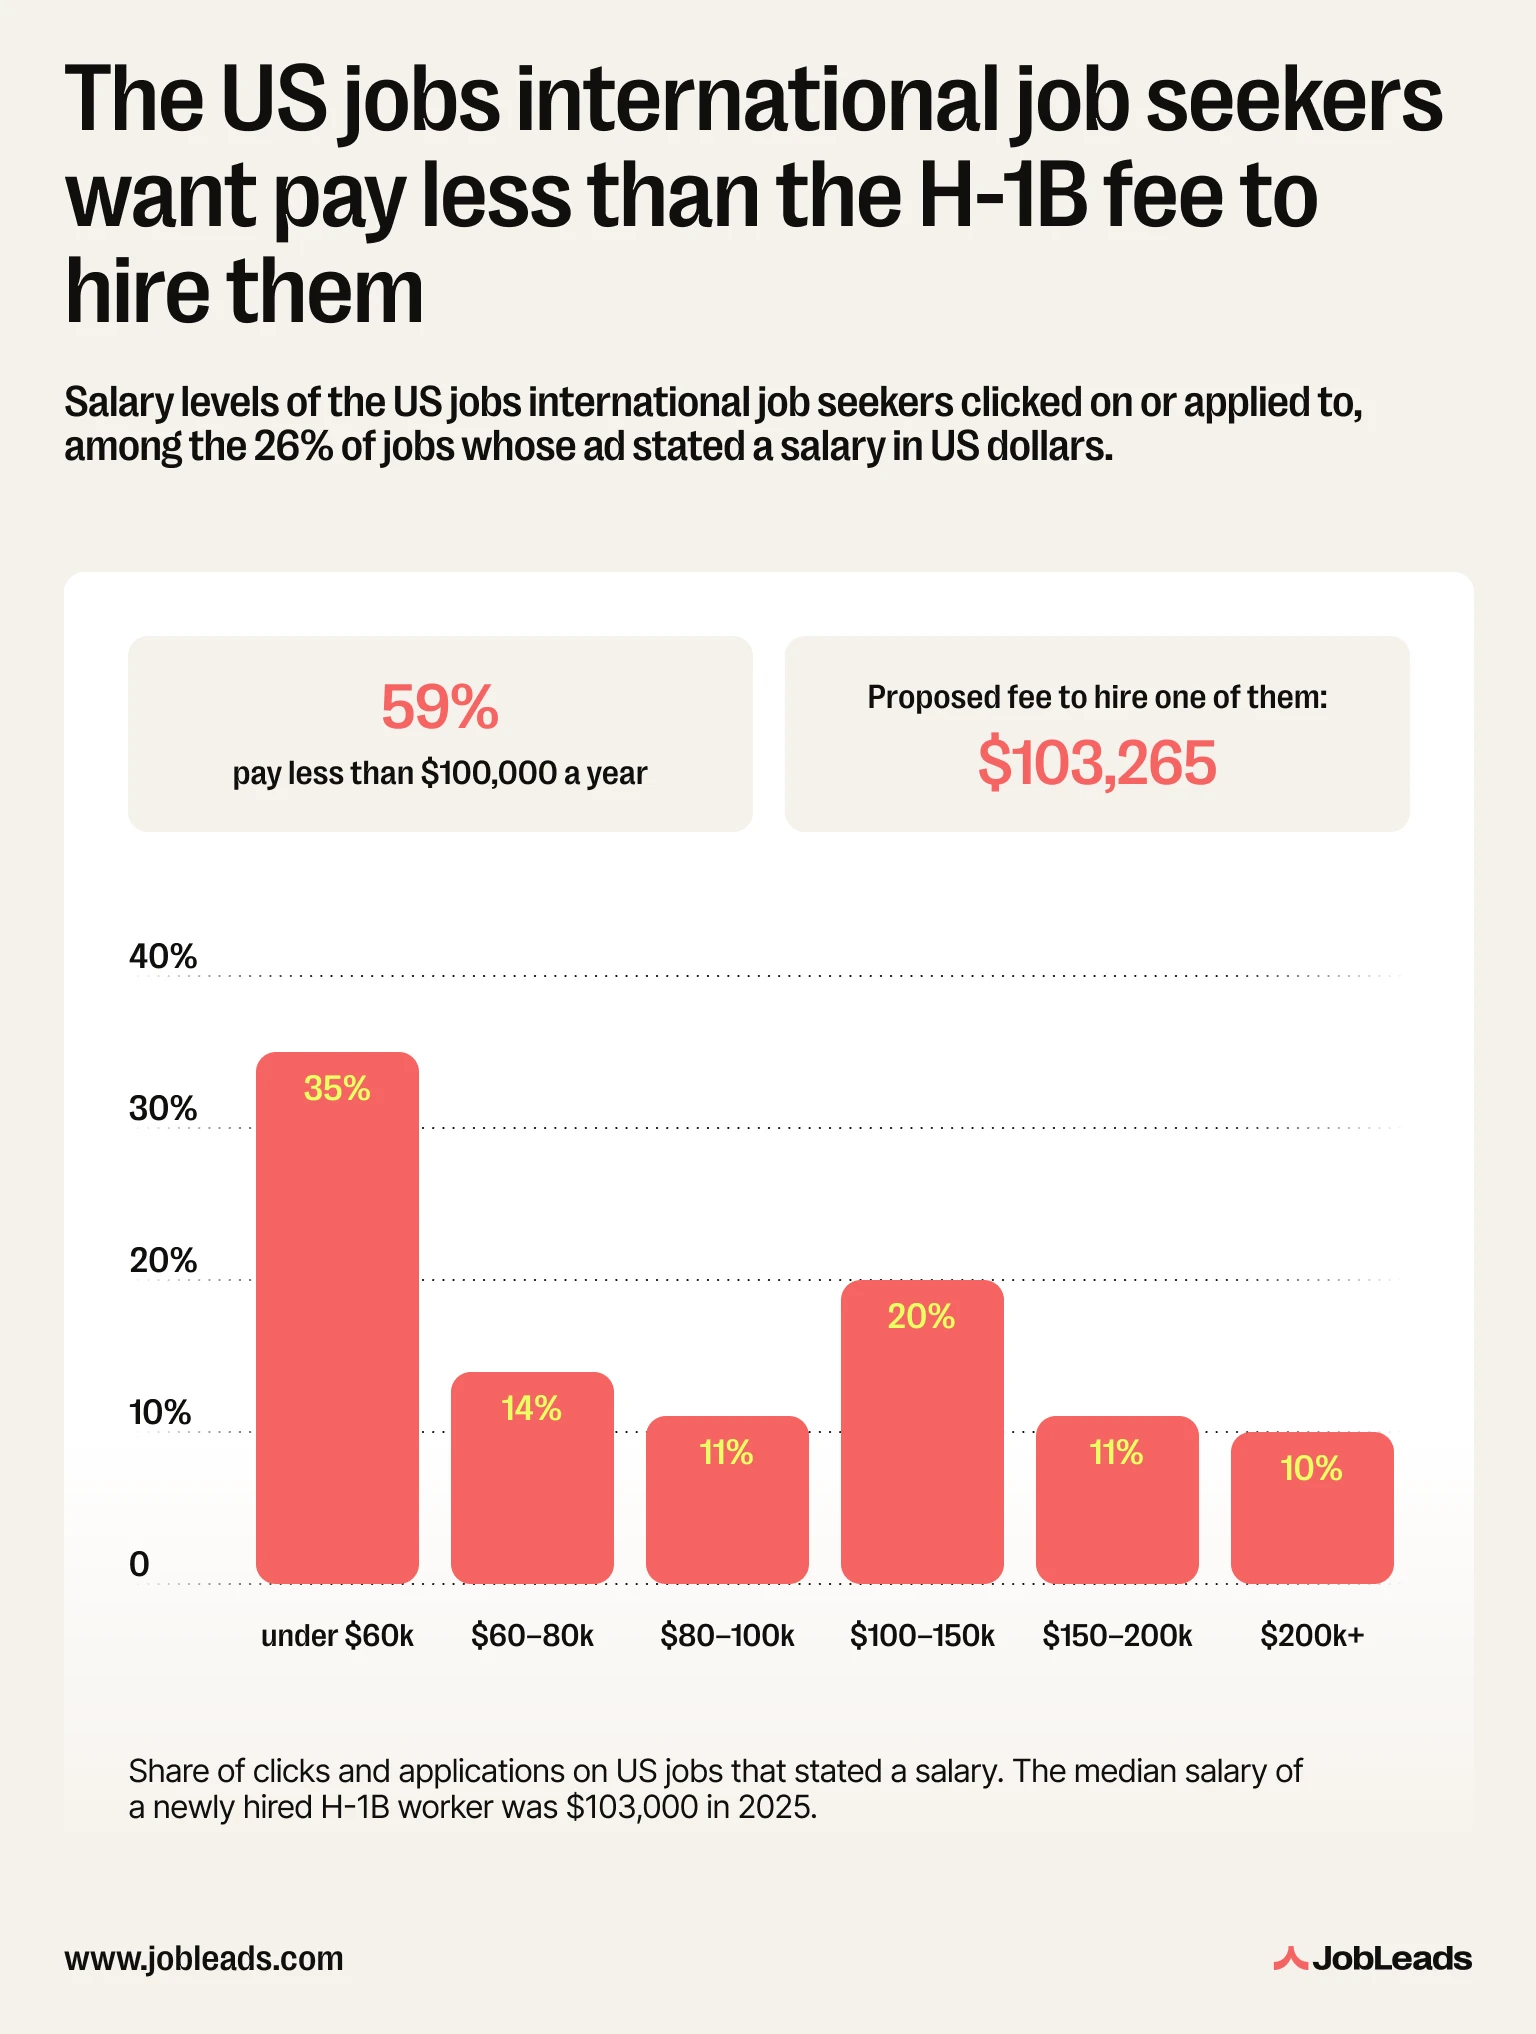
Now set that against the fee. In August 2026, DHS proposed a charge of $103,265 on every cap-subject H-1B petition, including those under the advanced-degree quota, payable at filing and on top of all existing fees.
USCIS's own figures make the comparison stark: the median salary of a newly hired H-1B worker in FY2025 was $103,000, and a quarter of new hires earned $77,000 or less. The proposed fee costs more than the median new H-1B hire earns in a year. Neither charge is currently in force.
The separate $100,000 fee imposed by proclamation in September 2025 remains blocked while three appeals courts weigh it. The $103,265 rule is a separate track: its comment period closed on 24 September 2026, DHS has not issued a final rule, and the earliest it could realistically apply is the 2027 cap season.
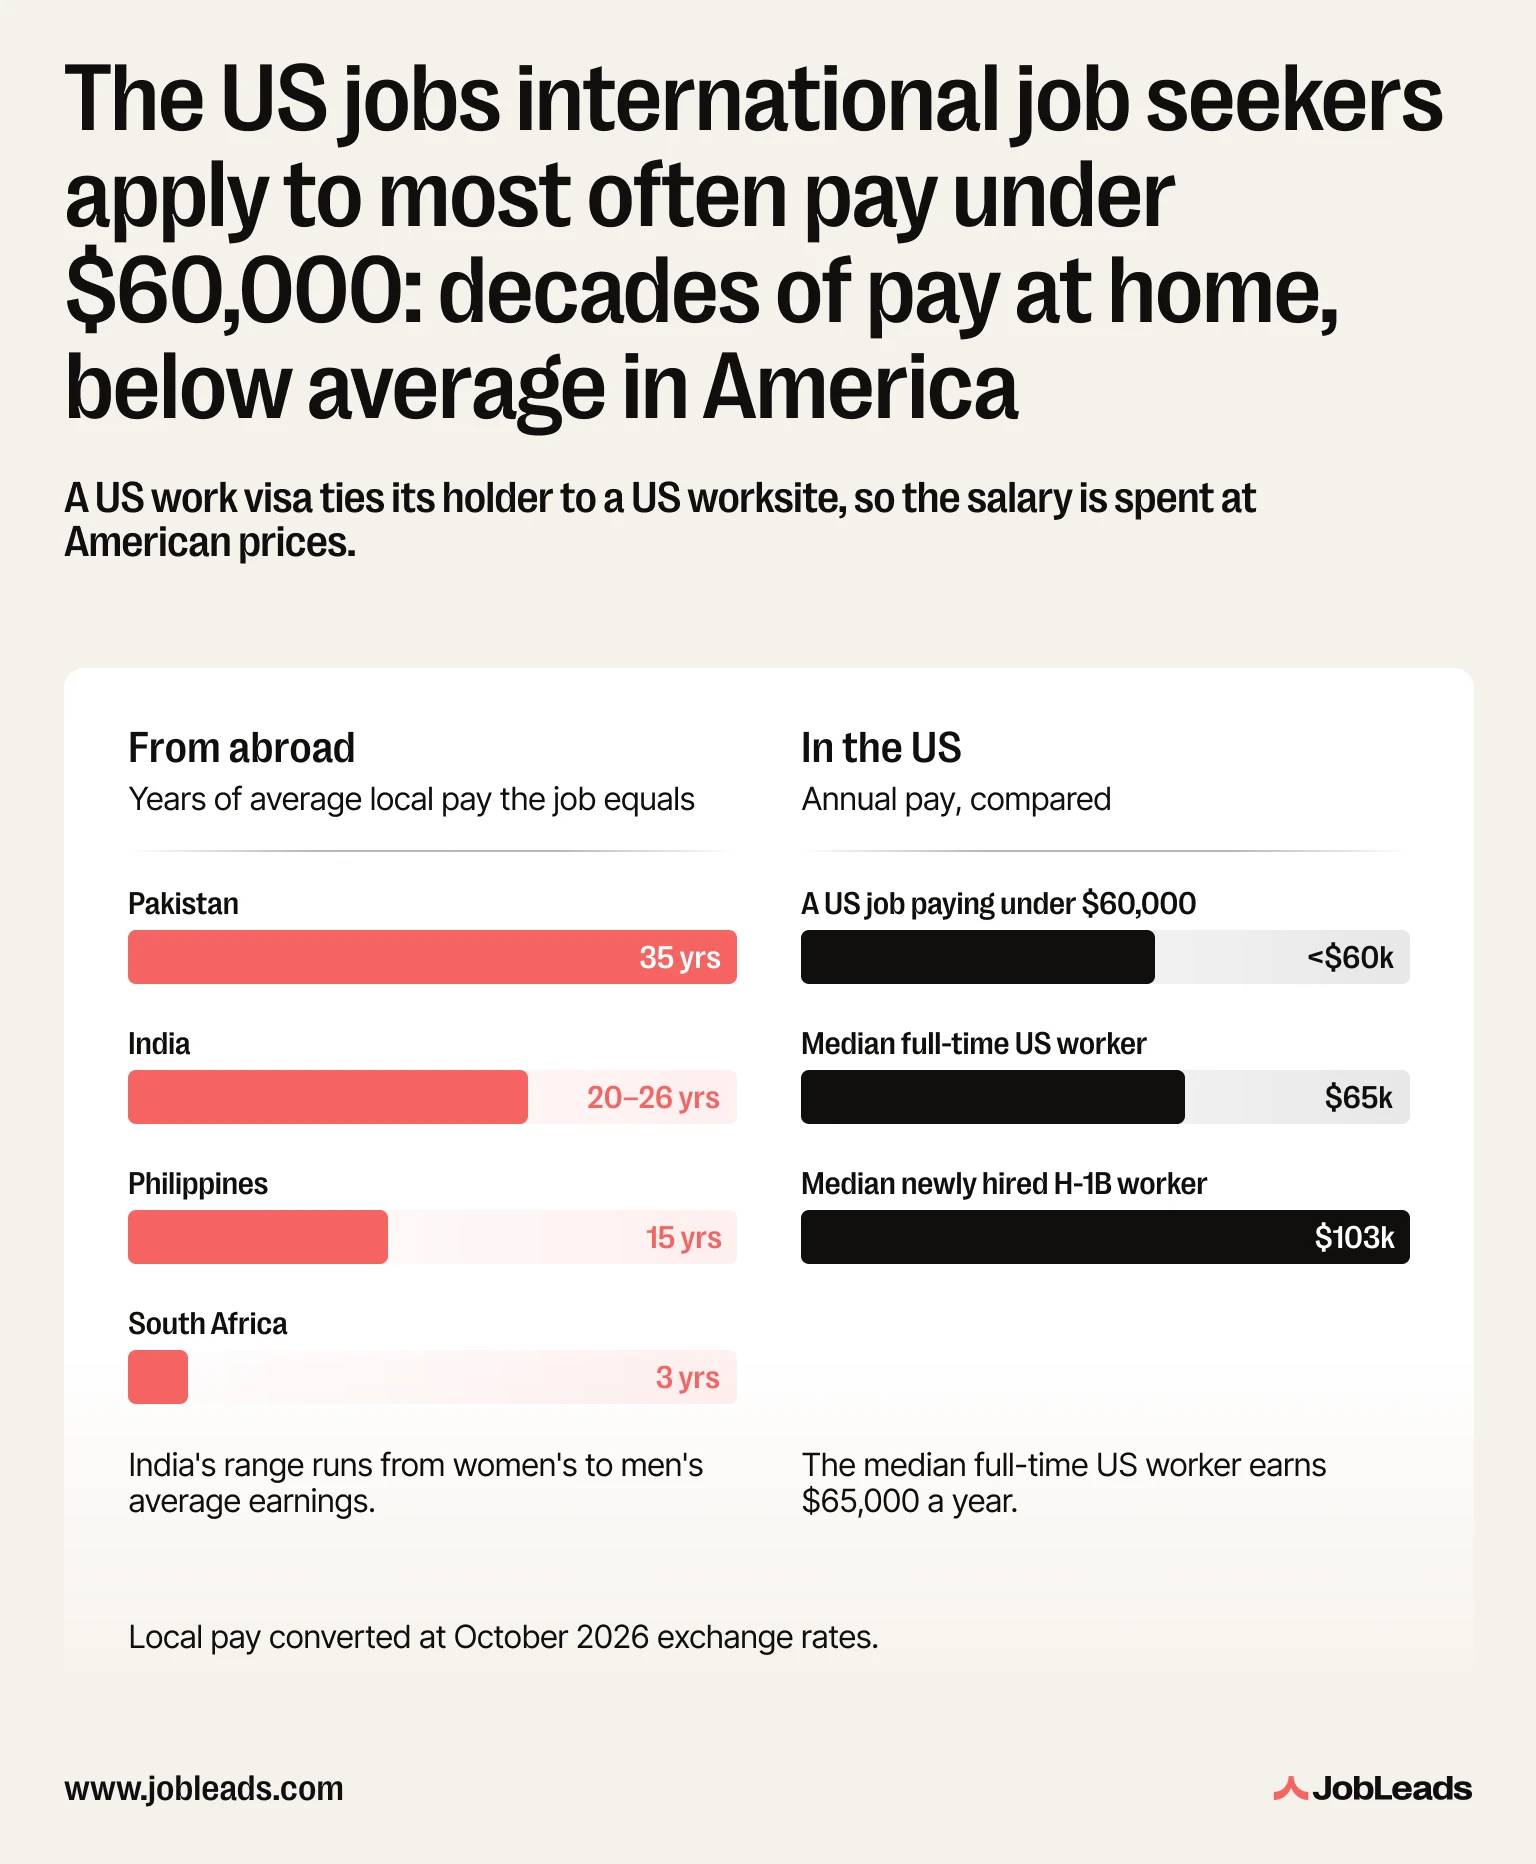
The largest single group of US jobs international candidates go after advertise less than $60,000 a year. Measured against pay at home, that is not a modest sum. In Pakistan, the average paid employee earned Rs39,042 a month in 2024-25 (around $1,700 a year)–so a $60,000 US job is roughly 35 years of that.
In India, regular salaried workers earned ₹18,353-₹24,217 a month in 2025, about $2,300-$3,000 a year, making the same US job worth 20 to 26 years of pay. In the Philippines, full-time workers averaged ₱21,544 a month in 2024 (around $4,100 a year), so a $60,000 job is close to 15 years' earnings.
South Africa is the exception here. Employees in the formal non-agricultural sector averaged R30,611 a month in 2026 (about $22,200 a year), which makes the same job worth under three years of pay.
But all of that assumes the money is spent at home, and it isn't. Many places in the US are among the highest-paying cities globally, but the taxes and prices are accordingly high. An H-1B is tied to a US worksite, so the salary is earned and spent at American prices. Seen from that side, a job paying under $60,000 is unremarkable: it sits below the $65,000 median for full-time US workers, and is about half the $103,000 median salary of a newly hired H-1B worker.
So, the jobs that look like a decade or more of pay for a foreign country are mostly below-average American jobs.
The whole H-1B debate mostly revolves around higher-paid foreign professionals, and the biggest spotlight is on workers employed in the tech sector. However, there seems to be a discrepancy between who is actually looking for work in the US, and who the media says is.
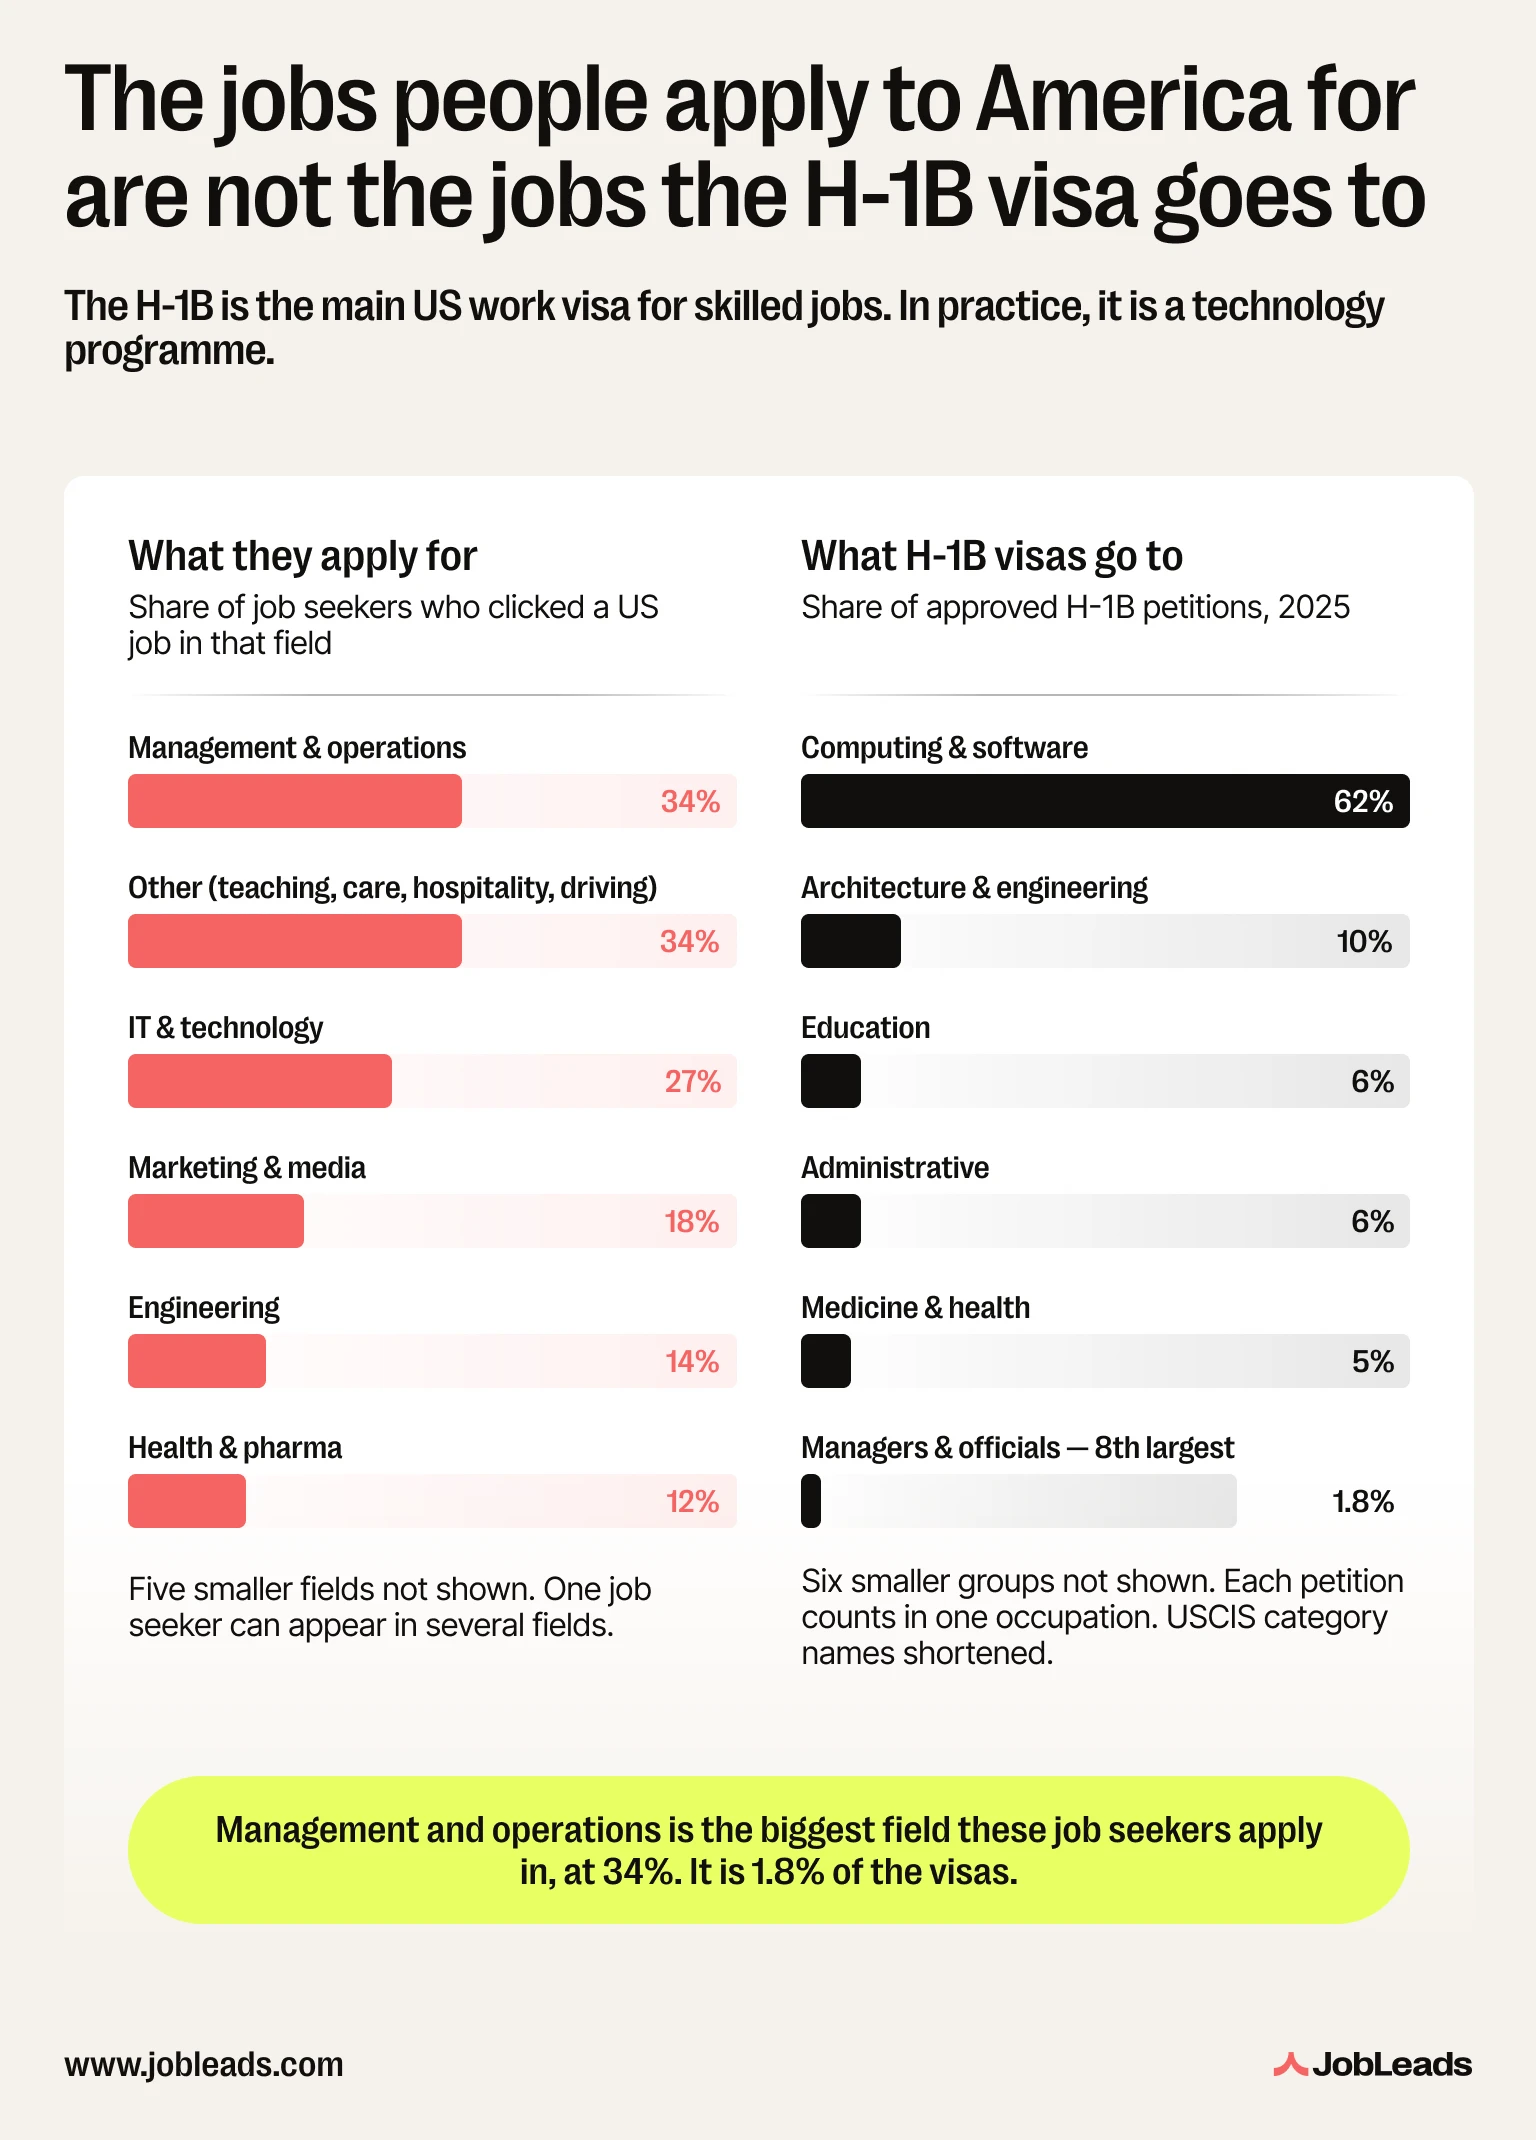
In the JobLeads' dataset, the people looking for jobs in the US are mostly not IT workers. The biggest field they click on is Management and Operations, at 34% of everyone who clicked on a US job. Level with it, also at 34%, is the group classified as "Other"–assistance roles, science, research and teaching, hospitality and driving.
IT and Technology comes third at 27%, which means 73% of international job seekers never clicked on a single US tech job. Below that the list runs through Marketing and Media at 18%, Engineering at 14%, Bio, Pharmacology and Health at 12%, Finance at 11%, Sales at 10% and Human Resources at 9%. Consulting and Legal come last, at 4% and 3%.
Set the two lists side by side and they barely overlap. Managers and officials accounted for 1.8% of H-1B approvals in 2025. Medicine and health took 4.8%, against the 12% of international job seekers who clicked on health roles or applied to one.
Meanwhile as many as 343,981 eligible H-1B registrations targeted those 85,000 available places in 2026. The mismatch is sharpest where the volume is: 41% of Indian job seekers and 40% of Polish ones clicked on or applied to tech jobs, against 17% in the Philippines and 16% in South Africa–the second and fourth largest groups applying to US jobs in this study.
Every JobLeads user is asked about their job search status when they sign up. Among those who went on to click on or apply to a US job, 29% said they were unemployed and actively looking, 24% that they were employed and looking to switch, and 23% that they were just browsing; 24% gave no answer.
The unemployed share runs highest in Pakistan at 36%, the Philippines and Venezuela at 35%, Colombia at 34%, and South Africa, Argentina and Turkey at 32%. It runs lowest in Saudi Arabia at 20%, the UK and Brazil at 21% and Germany at 23%. With one exception, the countries that turn searches into applications most aggressively are also the ones where the largest share of applicants have no job to fall back on.
The exception is India, and it's the consequential one. As many as 35% of Indian job seekers are employed and trying to change jobs, the highest share of any country measured.
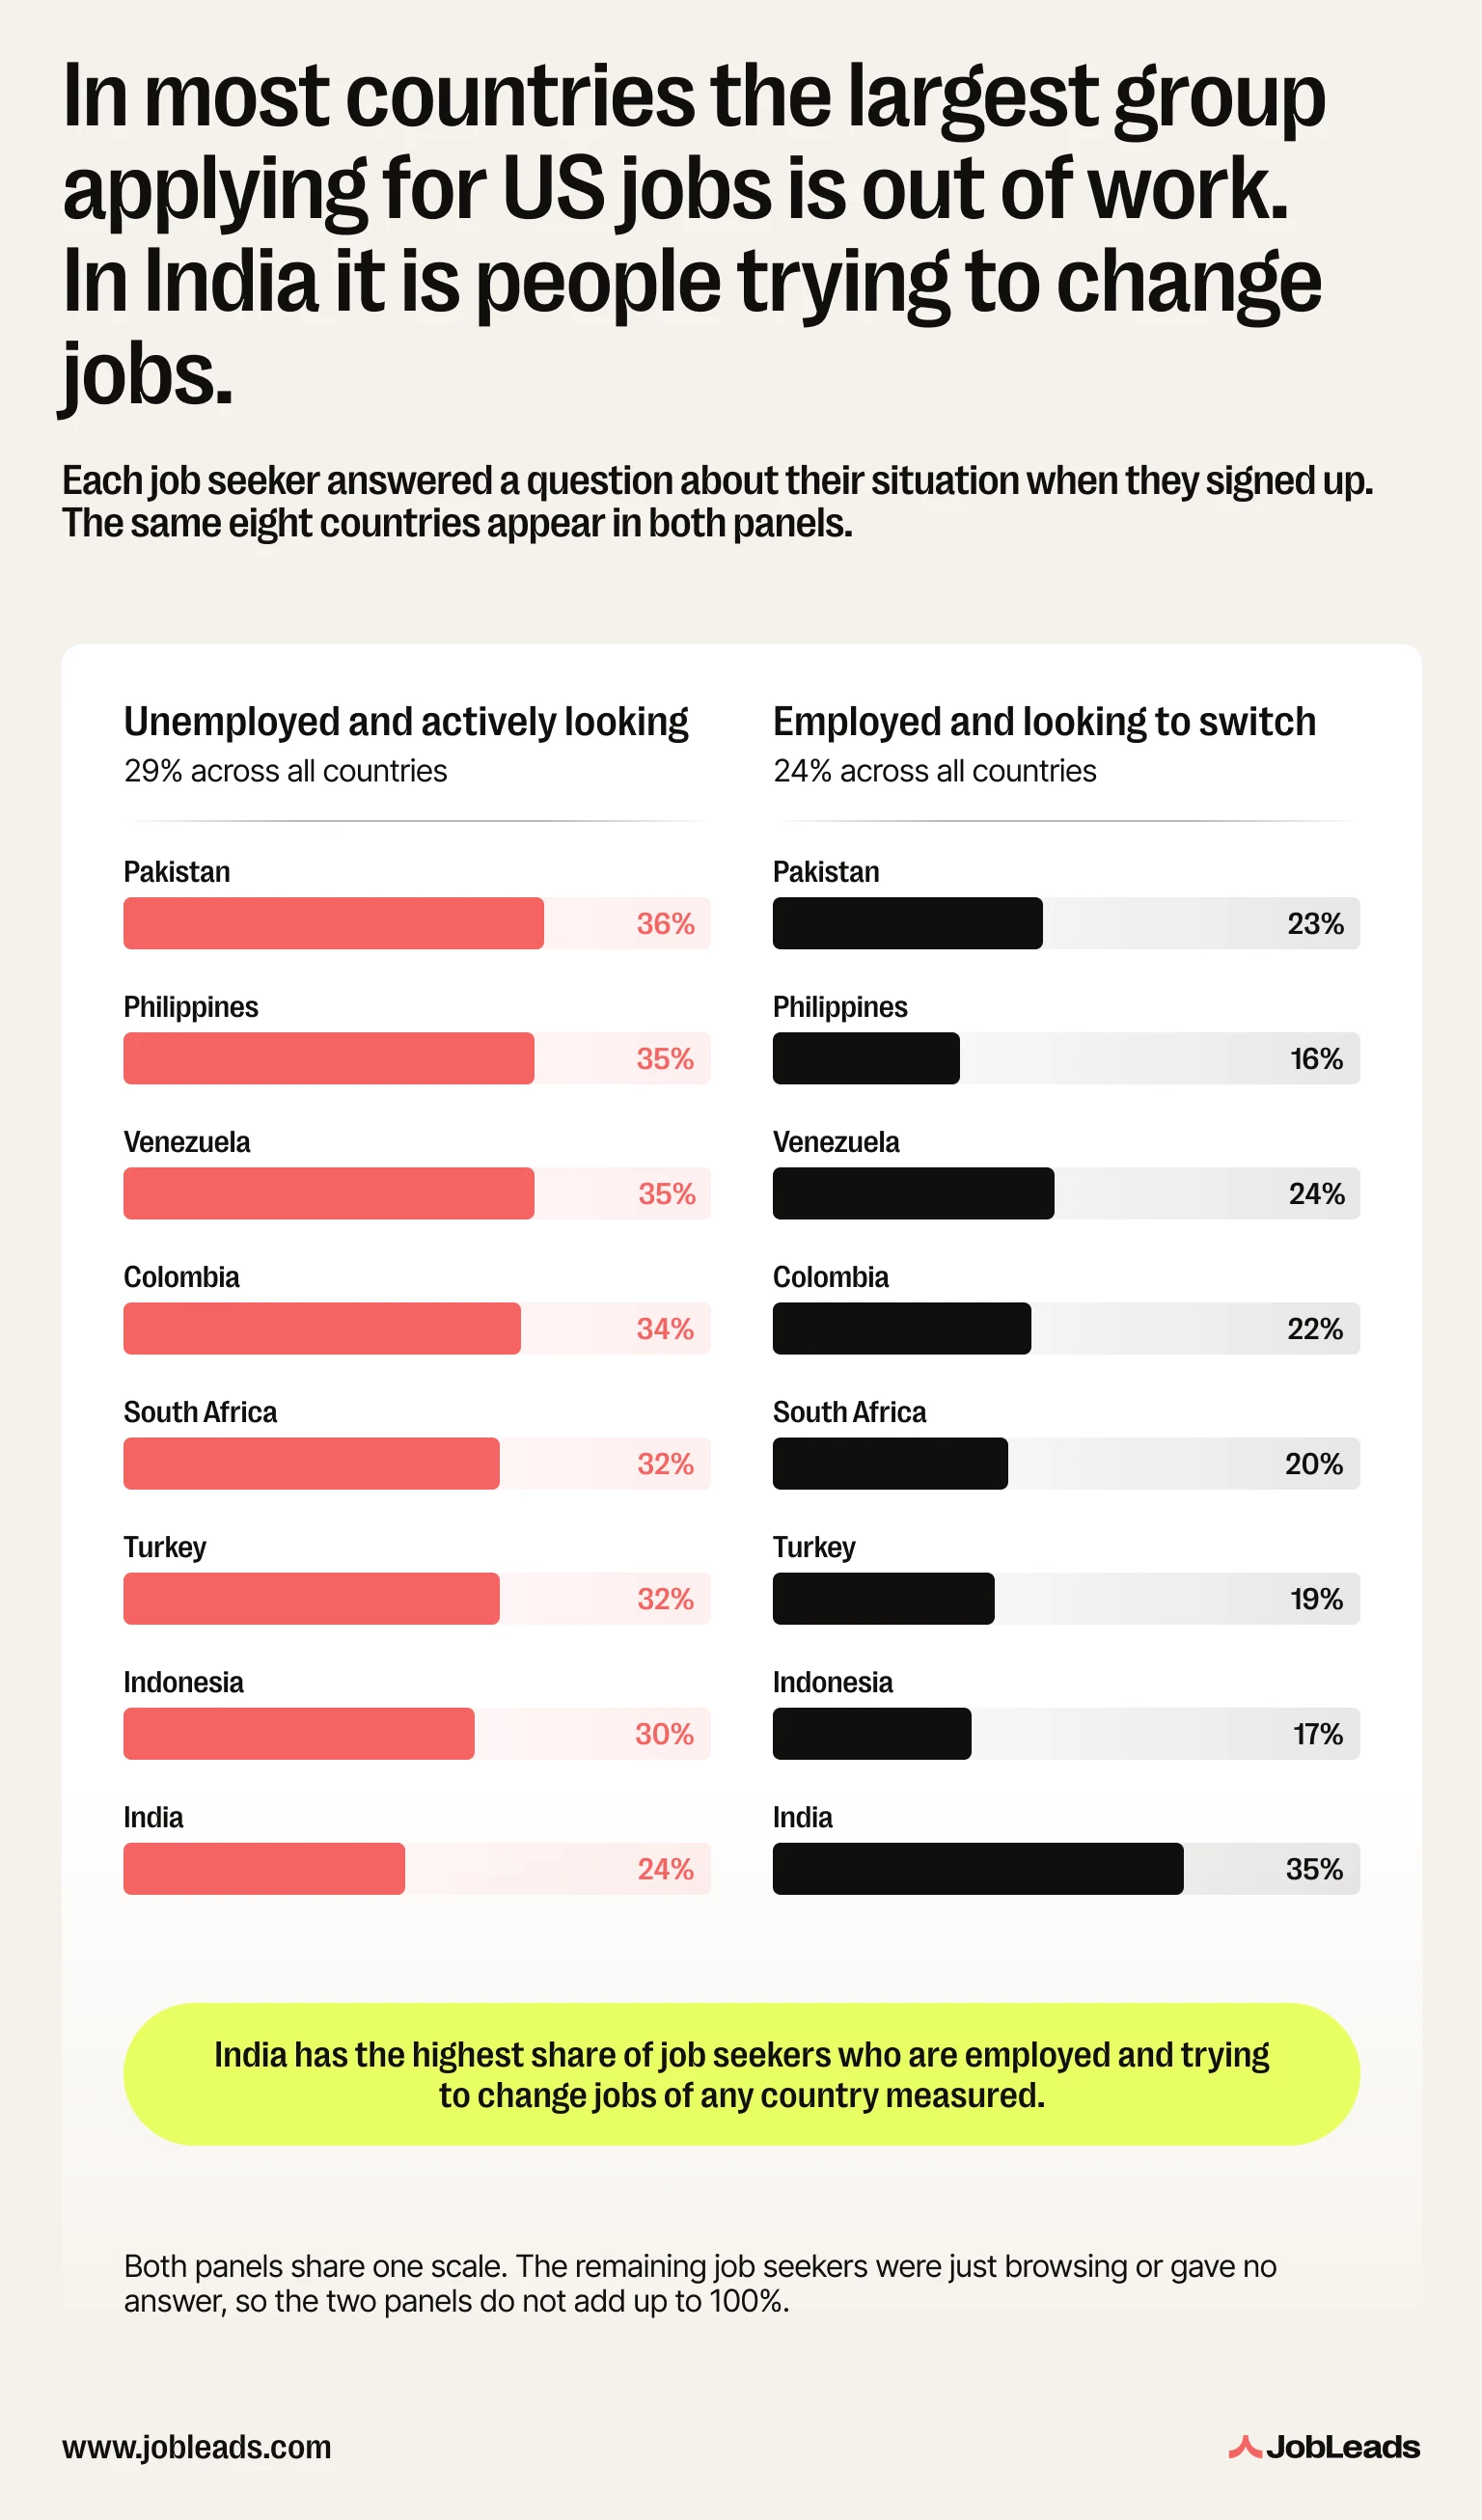
Switchers everywhere are also the most tech-heavy group in the data: 30% of them clicked on an IT job against 26% of the unemployed, and they lead on engineering, finance and consulting as well. That splits the people in this study across two different rules. The proposed removal of the 60-day grace period would end the window that lets a laid-off visa holder stay in the country and look for work–that falls on the unemployed. The suspension of eight employers from the green-card process on 8 October (including Microsoft, Adobe, Cognizant, Infosys, TCS, Wipro, HCL, Capgemini), breaks the route that makes changing employers worth the risk–that falls on the switchers.
Put the five findings side by side and the queue for American jobs looks very little like the debate in the media. Interest is not the same as intent: the UK generates one of the highest US jobs search volumes in this study, and just 7% of those people act on it, against 58% in Pakistan.
The jobs candidates act on are also not the prizes the debate imagines. Among those that state a salary, 59% pay under $100,000, and 35% pay under $60,000–below the $65,000 median for full-time American workers. Most of these people are not in technology at all: 73% never clicked a single tech job, while 62% of H-1B visa petitions go to computing and software roles.
That leaves a gap between the policy and the population it lands on.
A $103,265 fee attached to a job advertising under $60,000 is basically a closed door rather than a filter. And this door closes on employers hiring at the ordinary end of the American labor market rather than on the high-salary engineers the argument is about.
Jan Hendrik von Ahlen – Managing Director & Employment Expert, JobLeads
The H-1B debate is about who deserves one of 85,000 places. The harder question is what becomes of everyone applying anyway, for jobs that America currently has no obvious way to let them take.
This study looks at people using JobLeads in the 41 countries where it operates outside the United States, who searched for a job located in the US in 2026. 133,635 people ran such a search between 12 May and 25 August. 25,125 of them went on to click on or apply to a US job within half an hour of searching, and they did so 137,691 times between 12 May and 30 September.
What we know about those jobs comes from the job adverts themselves. Salaries are counted only where the advert states a figure in US dollars. Hourly, daily, weekly and monthly pay is turned into a yearly figure, and where an ad gives a range, we use the midpoint. The job field is JobLeads' own classification into eleven groups and describes the job, not the employer's industry. Job-search status is what each person said about their situation when they signed up, and a person's country is the one they registered in.
Before anything was counted, JobLeads removed activity that looked automated rather than human: accounts with more than 2,000 clicks, more than 300 different jobs applied to, or more than 200 actions on US jobs, along with sessions flagged as bots. That removed 190,623 of the 328,314 recorded actions on US jobs, most of them from six accounts.
The H-1B visa statistics come from USCIS. Other US figures come from the Bureau of Labor Statistics and the Federal Register. Wages in other countries come from each country's own statistics office, converted to US dollars at market exchange rates on 13 October 2026.
Conversion rates count a click or application on a US job at any point in the period and are not filtered for automated activity. The 25,125 users elsewhere in this study use the stricter 30-minute rule with automated activity removed. On that stricter rule the rates are lower: 36% in Pakistan, 35% in Indonesia and 34% in India.
Limitations:
The first column is each country's share of everyone searching for US jobs. The second is its share of everyone who went on to click or apply. The third is the share of that country's own searchers who acted on their search.
| Country | Share of searchers | Share of applicants | Acted on their search |
|---|---|---|---|
| United Kingdom | 14.1% | 4.4% | 7% |
| South Africa | 13.8% | 9.8% | 17% |
| Chile | 6.3% | 0.7% | 4% |
| Spain | 6.1% | 2.1% | 9% |
| India | 6.0% | 17.3% | 53% |
| Canada | 5.6% | 4.5% | 17% |
| Italy | 4.5% | 1.5% | 9% |
| Philippines | 4.3% | 12.0% | 49% |
| United Arab Emirates | 3.7% | 2.8% | 15% |
| Australia | 3.2% | 1.0% | 8% |
| Pakistan | 3.1% | 10.3% | 58% |
| Argentina | 3.0% | 1.1% | 10% |
| Mexico | 2.7% | 3.8% | 29% |
| Colombia | 2.5% | 2.5% | 20% |
| France | 2.4% | 2.2% | 15% |
| Brazil | 2.1% | 2.8% | 26% |
| Saudi Arabia | 1.9% | 1.8% | 20% |
| Germany | 1.6% | 2.0% | 29% |
| Portugal | 1.6% | 0.7% | 10% |
| Indonesia | 1.4% | 4.0% | 52% |
| Netherlands | 1.0% | 1.5% | 29% |
| New Zealand | 0.8% | 0.3% | 8% |
| Qatar | 0.8% | 0.7% | 19% |
| Peru | 0.8% | 0.9% | 24% |
| Malaysia | 0.7% | 0.8% | 20% |
| Switzerland | 0.7% | 0.3% | 11% |
| Turkey | 0.6% | 1.8% | 54% |
| Singapore | 0.6% | 0.6% | 24% |
| Ireland | 0.6% | 0.4% | 16% |
| Venezuela | 0.6% | 1.8% | 48% |
| Poland | 0.5% | 0.9% | 37% |
| Austria | 0.4% | 0.2% | 16% |
| Belgium | 0.4% | 0.4% | 21% |
| Kuwait | 0.3% | 0.3% | 20% |
| Denmark | 0.2% | 0.2% | not reported |
| Hong Kong | 0.2% | 0.4% | 34% |
| Sweden | 0.2% | 0.3% | 28% |
| Oman | 0.2% | 0.3% | 28% |
| Bahrain | 0.2% | 0.2% | 30% |
| Finland | 0.2% | not reported | 27% |
| Norway | 0.1% | 0.2% | 33% |
Feel free to share the findings from this study for editorial purposes. All we ask is that you credit JobLeads with a link back to this page, so readers can see the full methodology. Figures drawn from USCIS, the Bureau of Labor Statistics and the national statistics offices named here should be attributed to those sources directly. For additional data, the numbers behind any chart, or interview requests, contact press@jobleads.com.

Digital PR & Content Marketing Manager at JobLeads
Maryia leads digital PR and outreach at JobLeads. Her work has earned coverage in Fast Company, AOL, Forbes, Fortune, Quartz, and ZDnet—and she specialises in building the systems that make that happen at scale.
Job Market TrendsJobLeads ranked the 50 biggest US cities for graduates by what's left after rent, not headline pay. See where a starting salary stretches furthest.
 Job Market Trends
JobLeads data across 130M job postings reveals the highest-paying cities in the world. Learn how the ranking shifts once cost of living is applied.
 Job Market Trends
JobLeads analyzed over 53 million active postings globally to find which industries, countries, and roles have the most 6 figure salaries jobs.