
 Job Market Trends
April 21, 2026
The Salary Gap: 99% of Applicants Expect More Than Market Offers
JobLeads study on 811K job postings and 245K professionals reveals the differences in workers' salary expectations and wages offered by employers.


Which city pays the highest salary in the world?
It's a useful question and JobLeads' analysis of roughly 130 million job postings across 42 countries puts London on top, at a $140,000 median posted salary.
But the city that pays the most isn't always where workers keep the most. So, the more revealing question is "which city pays the most once cost of living is factored in". That's what tells you how much actually lands in your bank account.
So, adjust for cost of living and the ranking reshuffles: Leeds, Manchester and Glasgow all overtake every US tech hub on purchasing power.
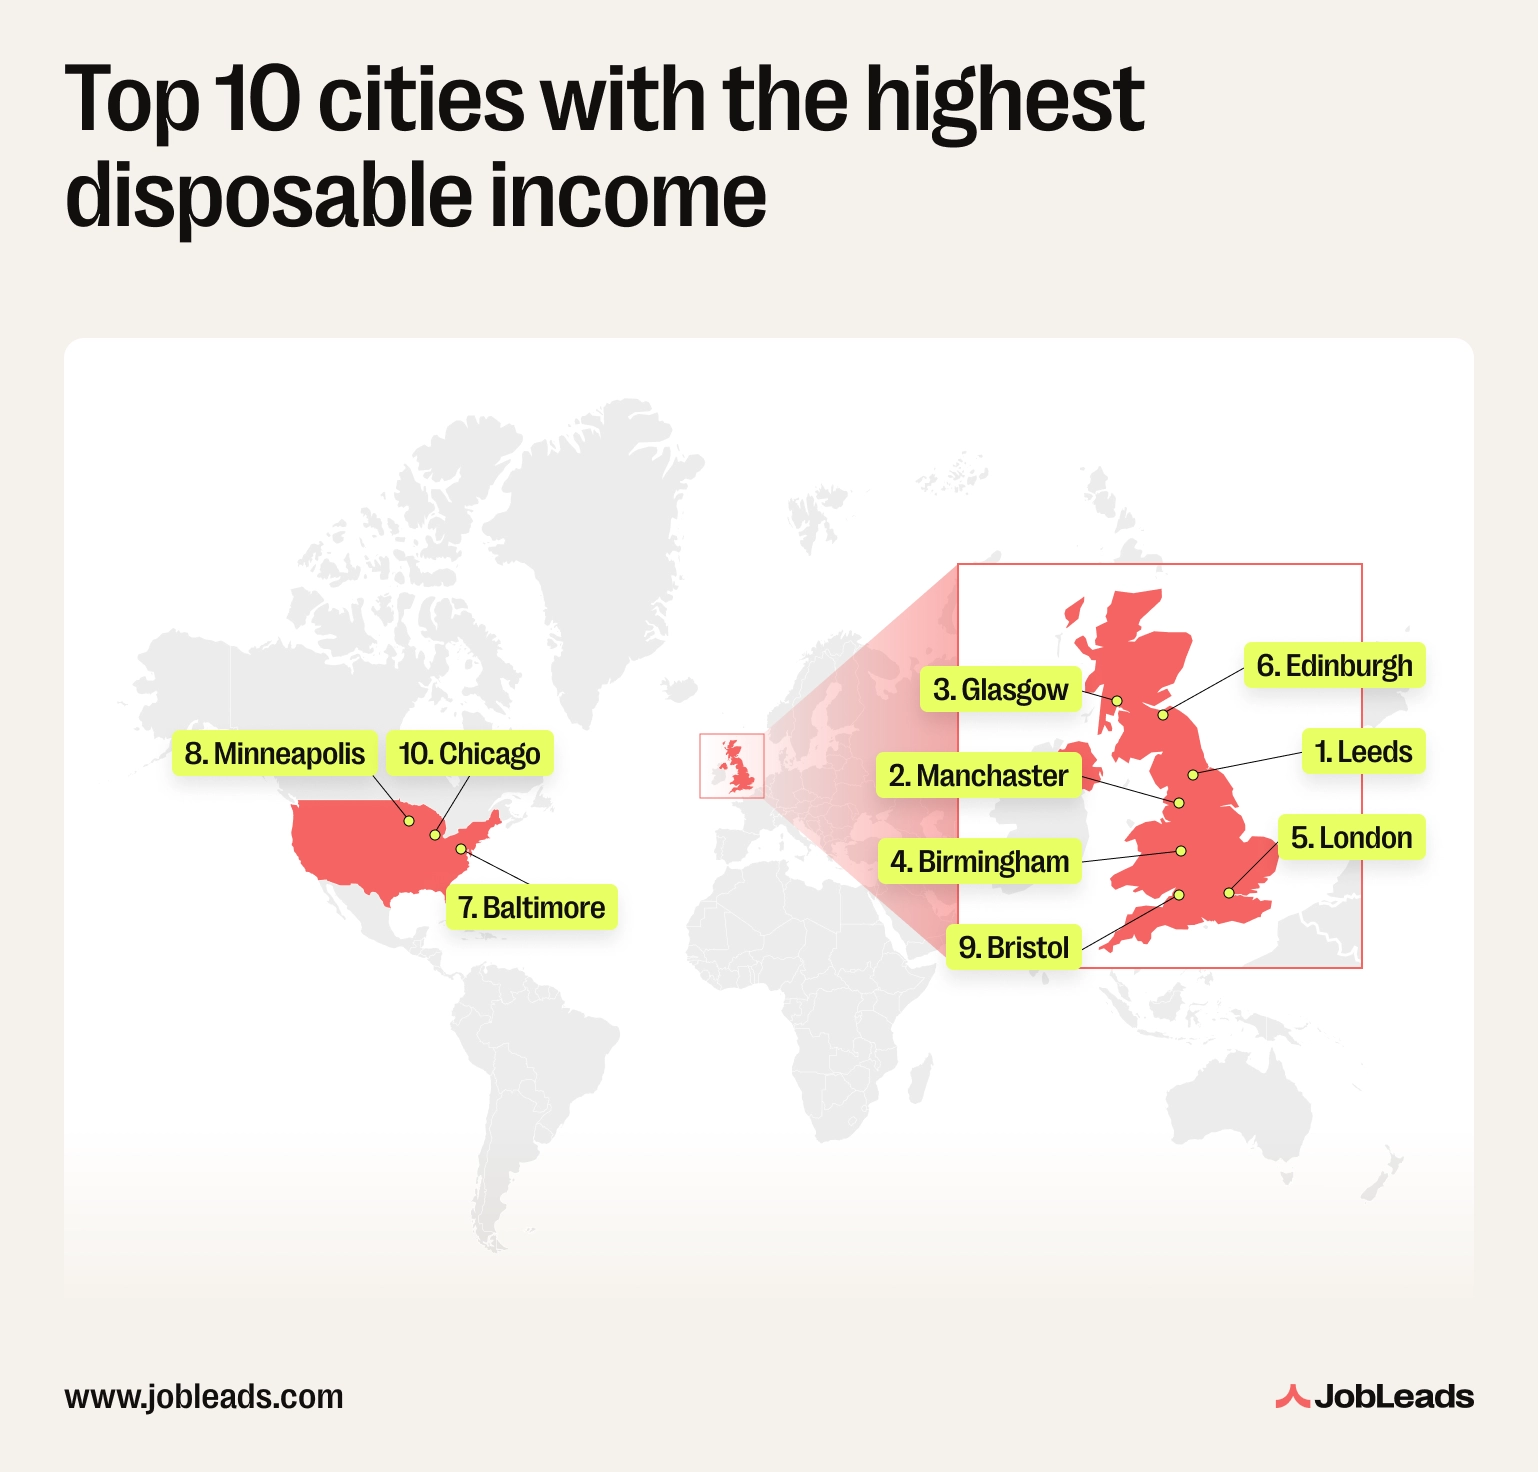
Here's a breakdown of the findings.
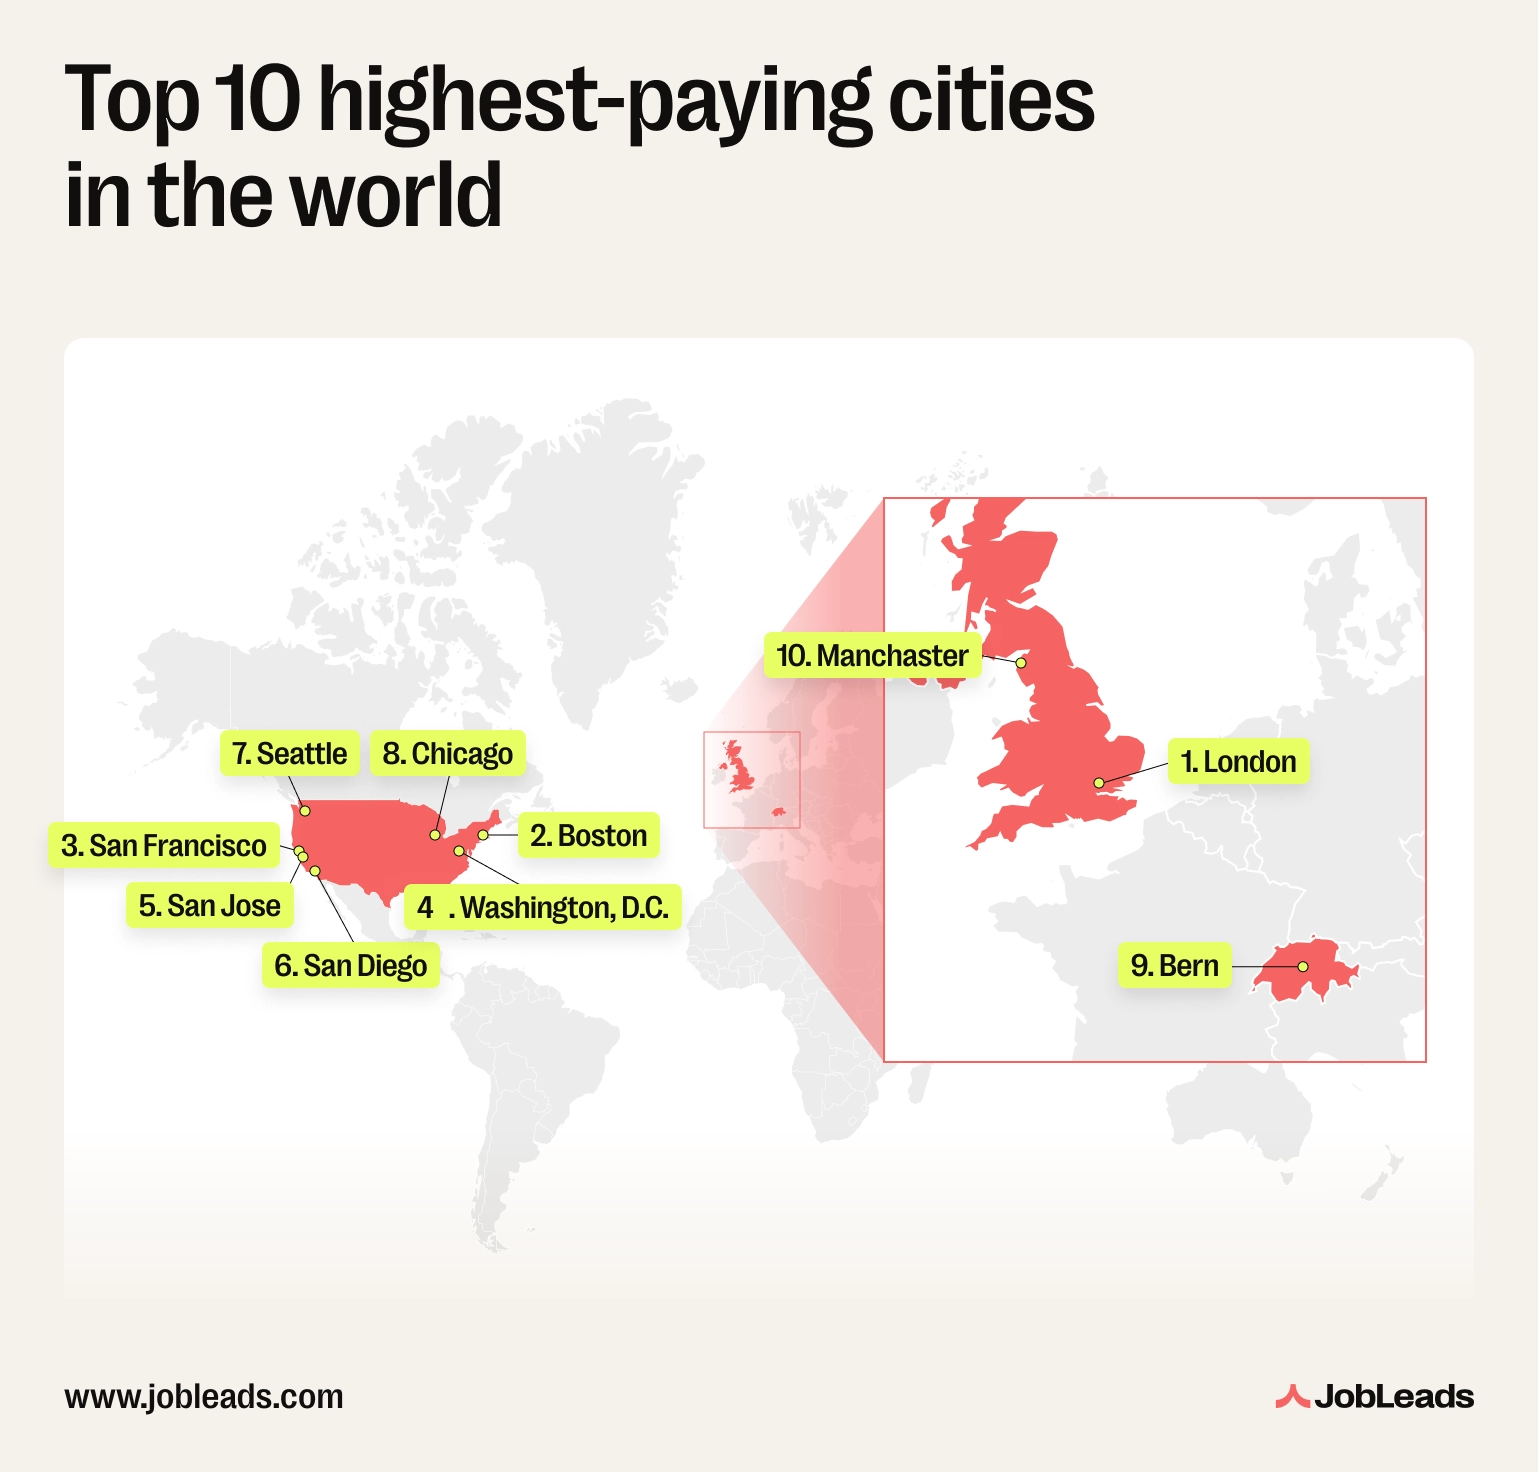
The 20 highest-paying major markets of 2025 are concentrated in just three countries: the United Kingdom, the United States and Switzerland. Together they account for every city in the table below.
Here's a table of the top 20 highest-paying cities in the world:
| # | City | Country | Median salary |
|---|---|---|---|
| 1 | London | UK | $140K |
| 2 | Boston | US | $130K |
| 3 | San Francisco | US | $130K |
| 4 | Washington DC | US | $125K |
| 5 | San Jose | US | $119K |
| 6 | San Diego | US | $114K |
| 7 | Seattle | US | $113K |
| 8 | Chicago | US | $112K |
| 9 | Bern | CH | $109K |
| 10 | Manchester | UK | $105K |
| 11 | Zurich | CH | $105K |
| 12 | Glasgow | UK | $100K |
| 13 | Miami | US | $100K |
| 14 | Baltimore | US | $99.4K |
| 15 | Edinburgh | UK | $99.0K |
| 16 | Leeds | UK | $97.8K |
| 17 | Minneapolis | US | $95K |
| 18 | Denver | US | $90K |
| 19 | Birmingham | UK | $90K |
| 20 | Bristol | UK | $90K |
Note
To qualify as a "major market," a city must have recorded at least 50,000 job postings on the JobLeads platform across the year. This threshold excludes Silicon Valley's small tech-satellite towns (Menlo Park, Palo Alto, Cupertino, Mountain View and Foster City) where high medians rest on thin posting volumes concentrated in a single industry.
At a $140,000 median posted salary, London outranks every US city in the dataset. The next four positions belong to Boston ($130K), San Francisco ($130K), Washington DC ($125K) and San Jose ($119K).
A separate cross-check against the US Bureau of Labor Statistics OEWS data supports the order at the top of the US table. It ranks San Jose, San Francisco, Boston and Washington DC among the highest-paying US metropolitan areas–the same four cities that lead the JobLeads US table.
The top 20 concentrates almost entirely in North America and Europe. Salary levels drop sharply across Asia-Pacific, the Middle East and Latin America. Here are more details:
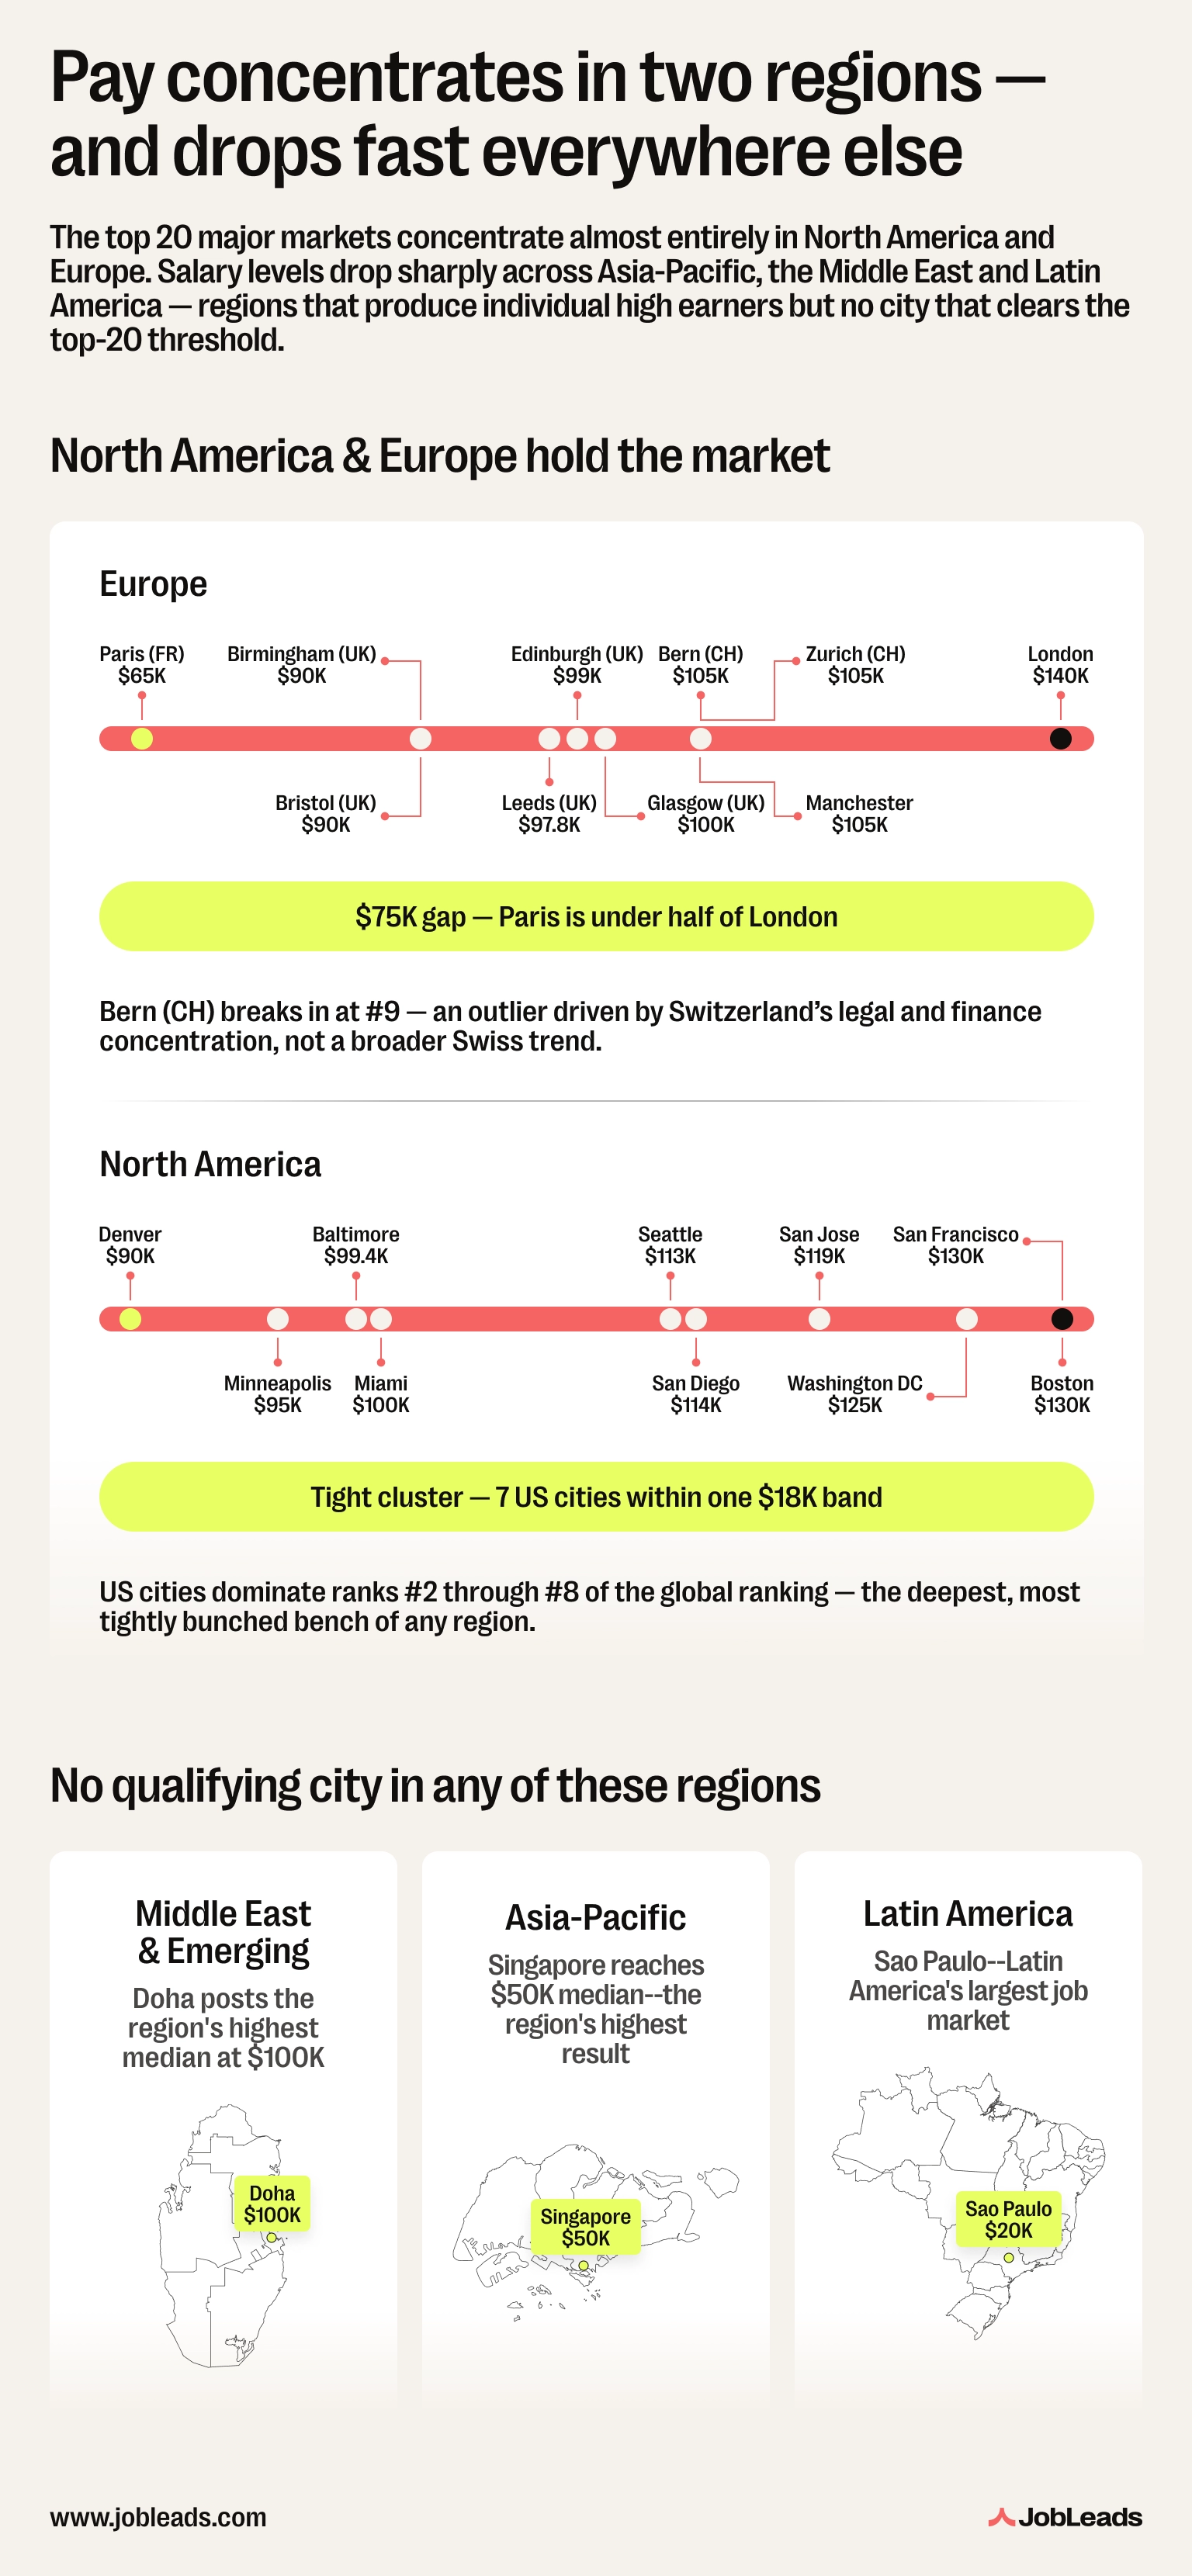
What separates these two tiers isn't national wealth–it's individual cities. North America's edge comes from depth: seven markets crowded into a single $18K band. Europe's edge comes from concentration in one place: strip out London, and the region's advantage over Paris nearly disappears. Everywhere else, a single boutique market sets the regional ceiling rather than reflecting broader strength–Doha, Singapore, and São Paulo all top their regions without lifting them.
The relationship between pay and engagement is not symmetrical. New York, Washington DC and Chicago lead the global application rate table at 44%, 42% and 41% respectively. This gives the United States all three top positions.
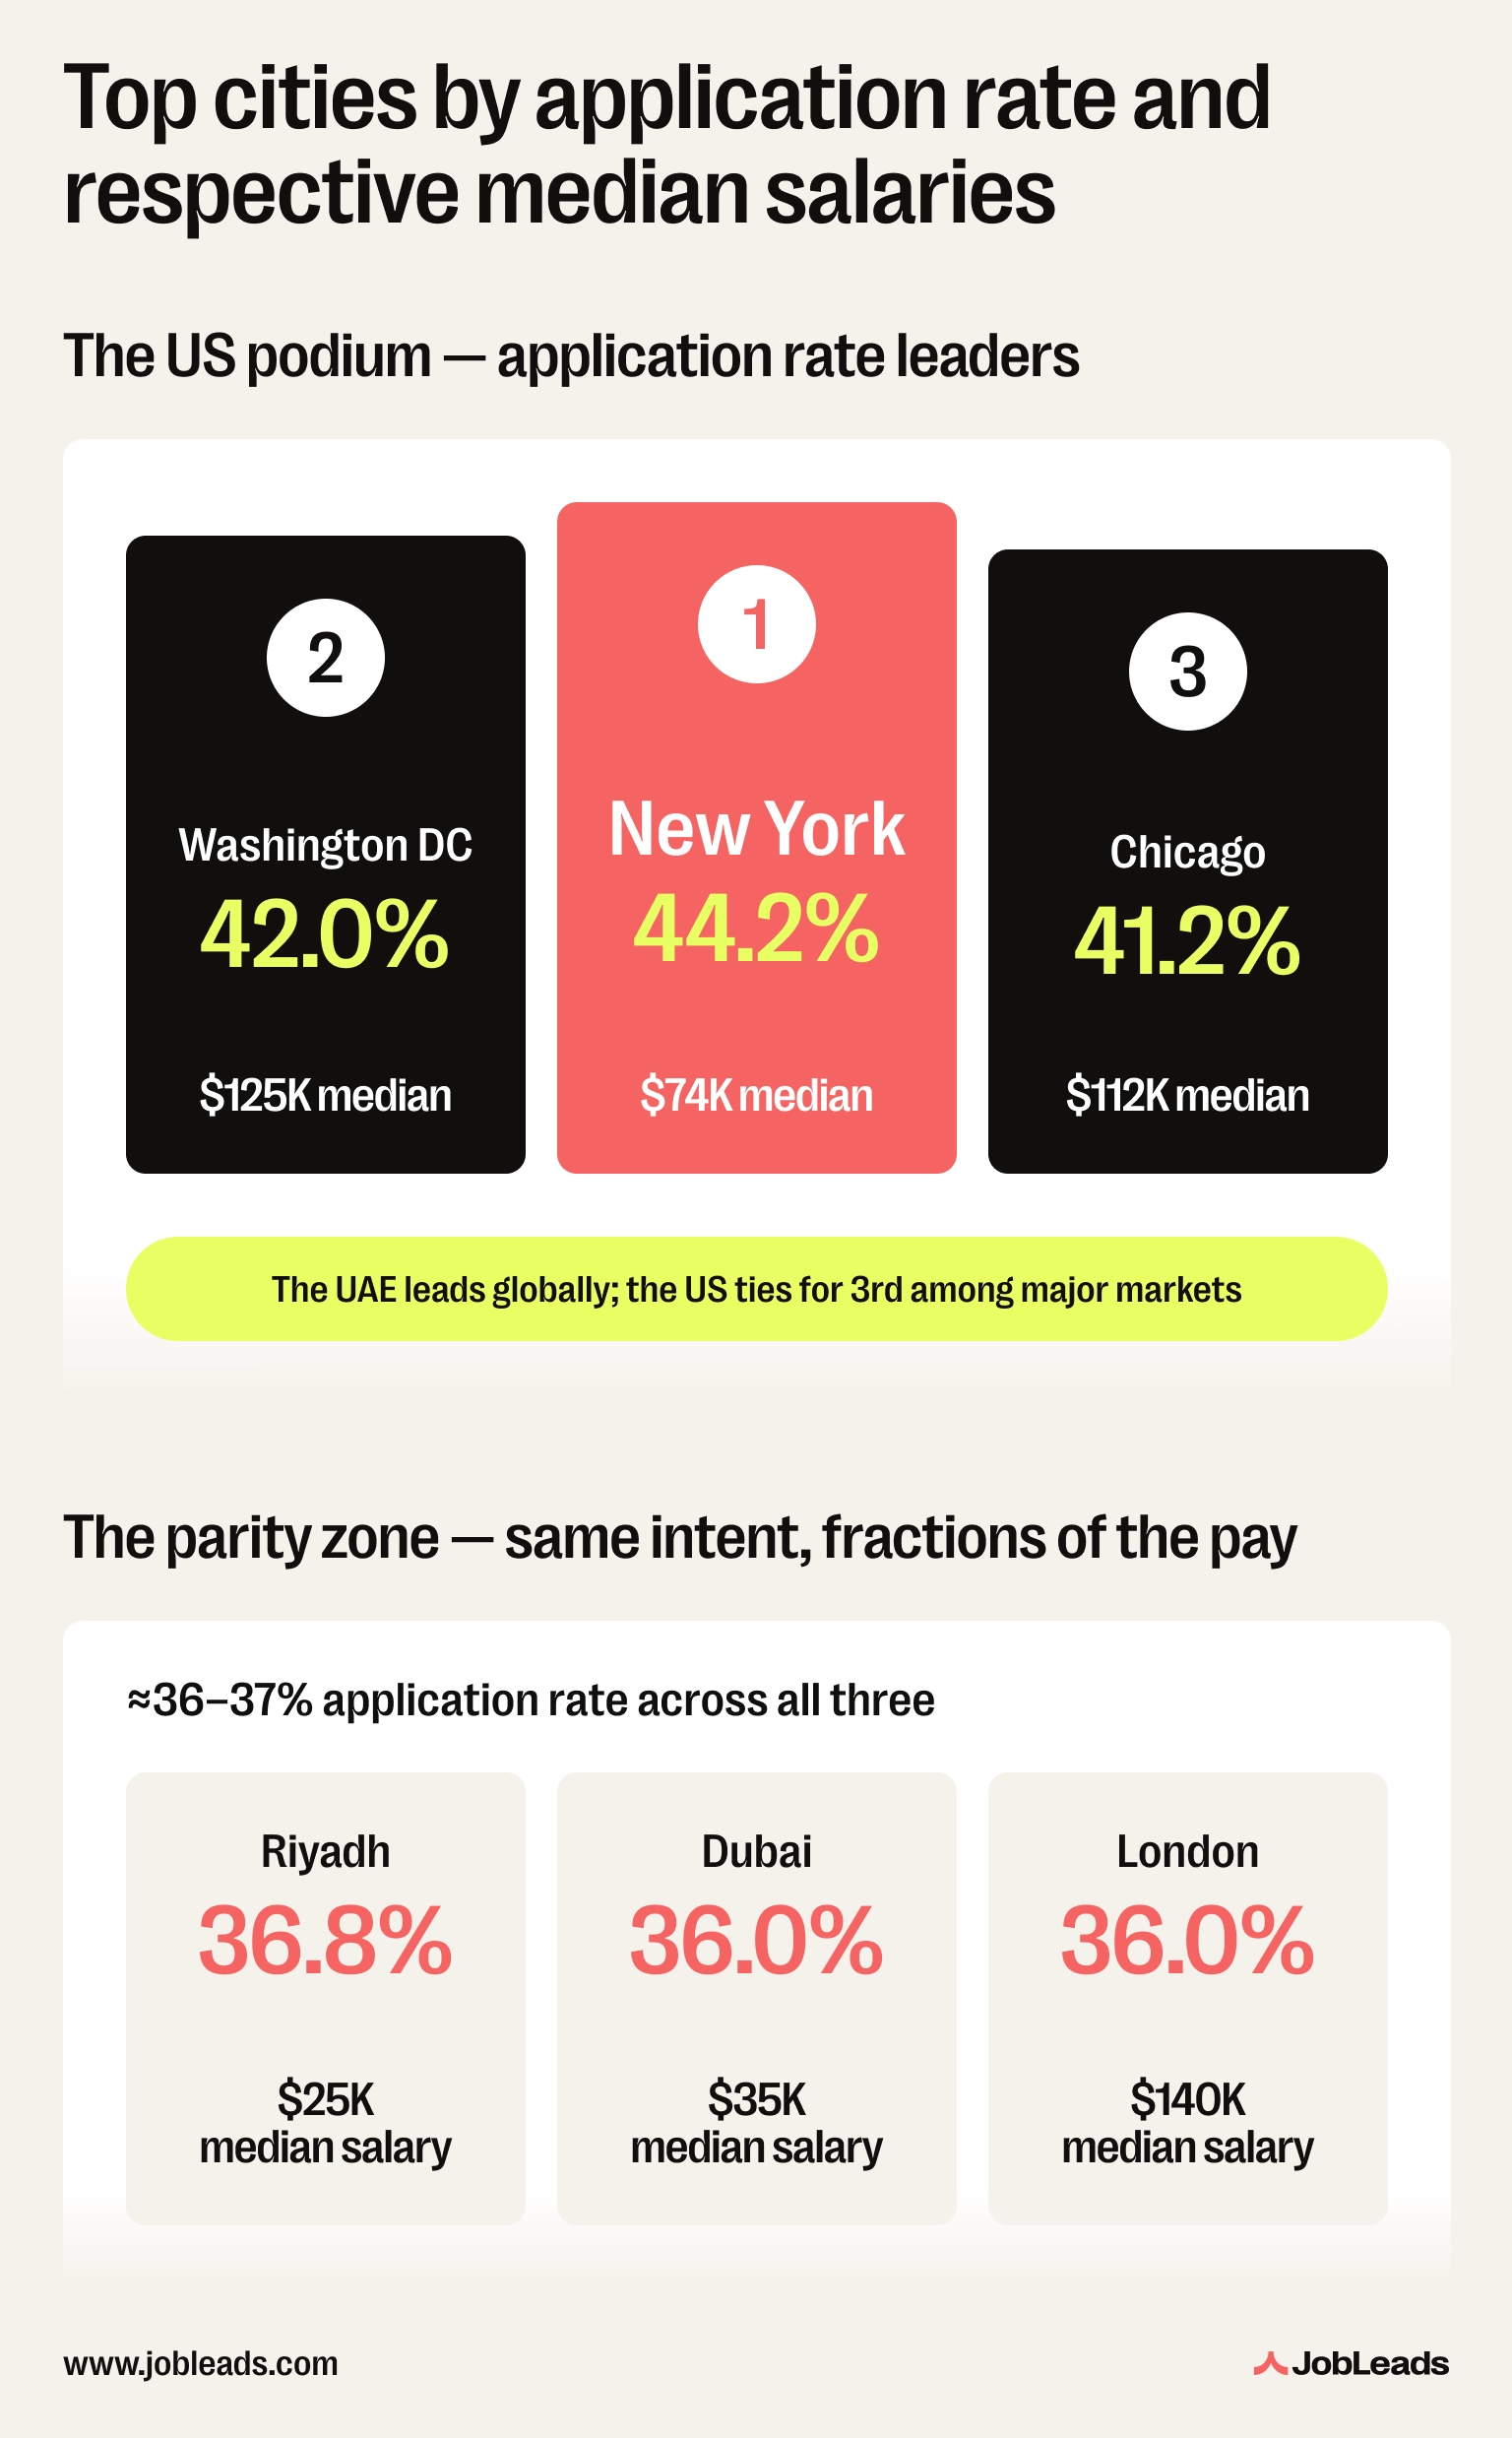
But Dubai ($35K median) and London ($140K) record an identical 36% application rate, while Riyadh converts at nearly 37%–a market with a far lower salary base than London's, yet comparable intent. It broadly tracks salary at the top of the US ranking and breaks down completely outside it.
Headline salary is only half the story. The single biggest reshuffle in the rankings is what happens to the top 20 once cost of living is applied.
Combining JobLeads' median posted salary (USD) with the Numbeo Cost of Living Plus Rent Index–which sets New York at 100 as the baseline–produces a purchasing-power figure: the New York-equivalent value of each city's median salary.
The cities that emerge at the top are those with the highest income-to-cost-of-living ratio. High enough wages to matter, low enough cost of living to keep them.
The result inverts the table of the top 20 major markets purchasing-power ranking:
| # | City | Country | Median salary | Numbeo CoL + Rent Index (NY=100) | NY-equivalent purchasing power |
|---|---|---|---|---|---|
| 1 | Leeds | UK | $98K | 45.0 | $217,800 |
| 2 | Manchester | UK | $105K | 49 | $215,200 |
| 3 | Glasgow | UK | $100K | 47 | $212,300 |
| 4 | Birmingham | UK | $90K | 44 | $203,200 |
| 5 | London | UK | $140K | 73 | $192,800 |
| 6 | Edinburgh | UK | $99K | 52 | $190,000 |
| 7 | Baltimore | US | $99K | 55 | $180,000 |
| 8 | Minneapolis | US | $95K | 53 | $178,600 |
| 9 | Bristol | UK | $90K | 51 | $177,900 |
| 10 | Chicago | US | $112K | 65 | $172,800 |
| 11 | Washington DC | US | $125K | 74 | $170,100 |
| 12 | Boston | US | $130K | 80 | $162,700 |
| 13 | Seattle | US | $113K | 70 | $162,100 |
| 14 | Bern | CH | $109K | 68 | $161,200 |
| 15 | San Diego | US | $114K | 73 | $156,000 |
| 16 | San Francisco | US | $130K | 85 | $152,900 |
| 17 | Denver | US | $90K | 62 | $144,500 |
| 18 | Miami | US | $100K | 71 | $140,800 |
| 19 | San Jose | US | $119K | 85 | $140,000 |
| 20 | Zurich | CH | $105K | 84 | $124,900 |
Six UK cities in the original top 20 rise to the top six of the purchasing-power ranking. Leeds, Manchester and Glasgow take the top three slots globally. Their salaries are not the highest in absolute terms but their cost-of-living indices (45, 49 and 47 respectively) are roughly half New York's.
To paint the picture: a $98K Leeds salary buys what $218K would buy in New York.
Birmingham jumps fifteen ranks, from #19 to #4. Edinburgh rises nine, from #15 to #6. Baltimore (US, +7) and Minneapolis (US, +9) are the only non-UK cities to crack the global top 8 on purchasing power.
The losers are the US tech corridors and Swiss financial hubs:
The pattern is consistent: cities with reputation-driven labor markets extract a meaningful "city tax" from headline salaries through housing and goods costs. Cities with strong sectoral pay but moderate housing markets deliver the best purchasing power per dollar earned. This is also the textbook profile of the best cities for graduates: lower cost of living paired with higher wages.
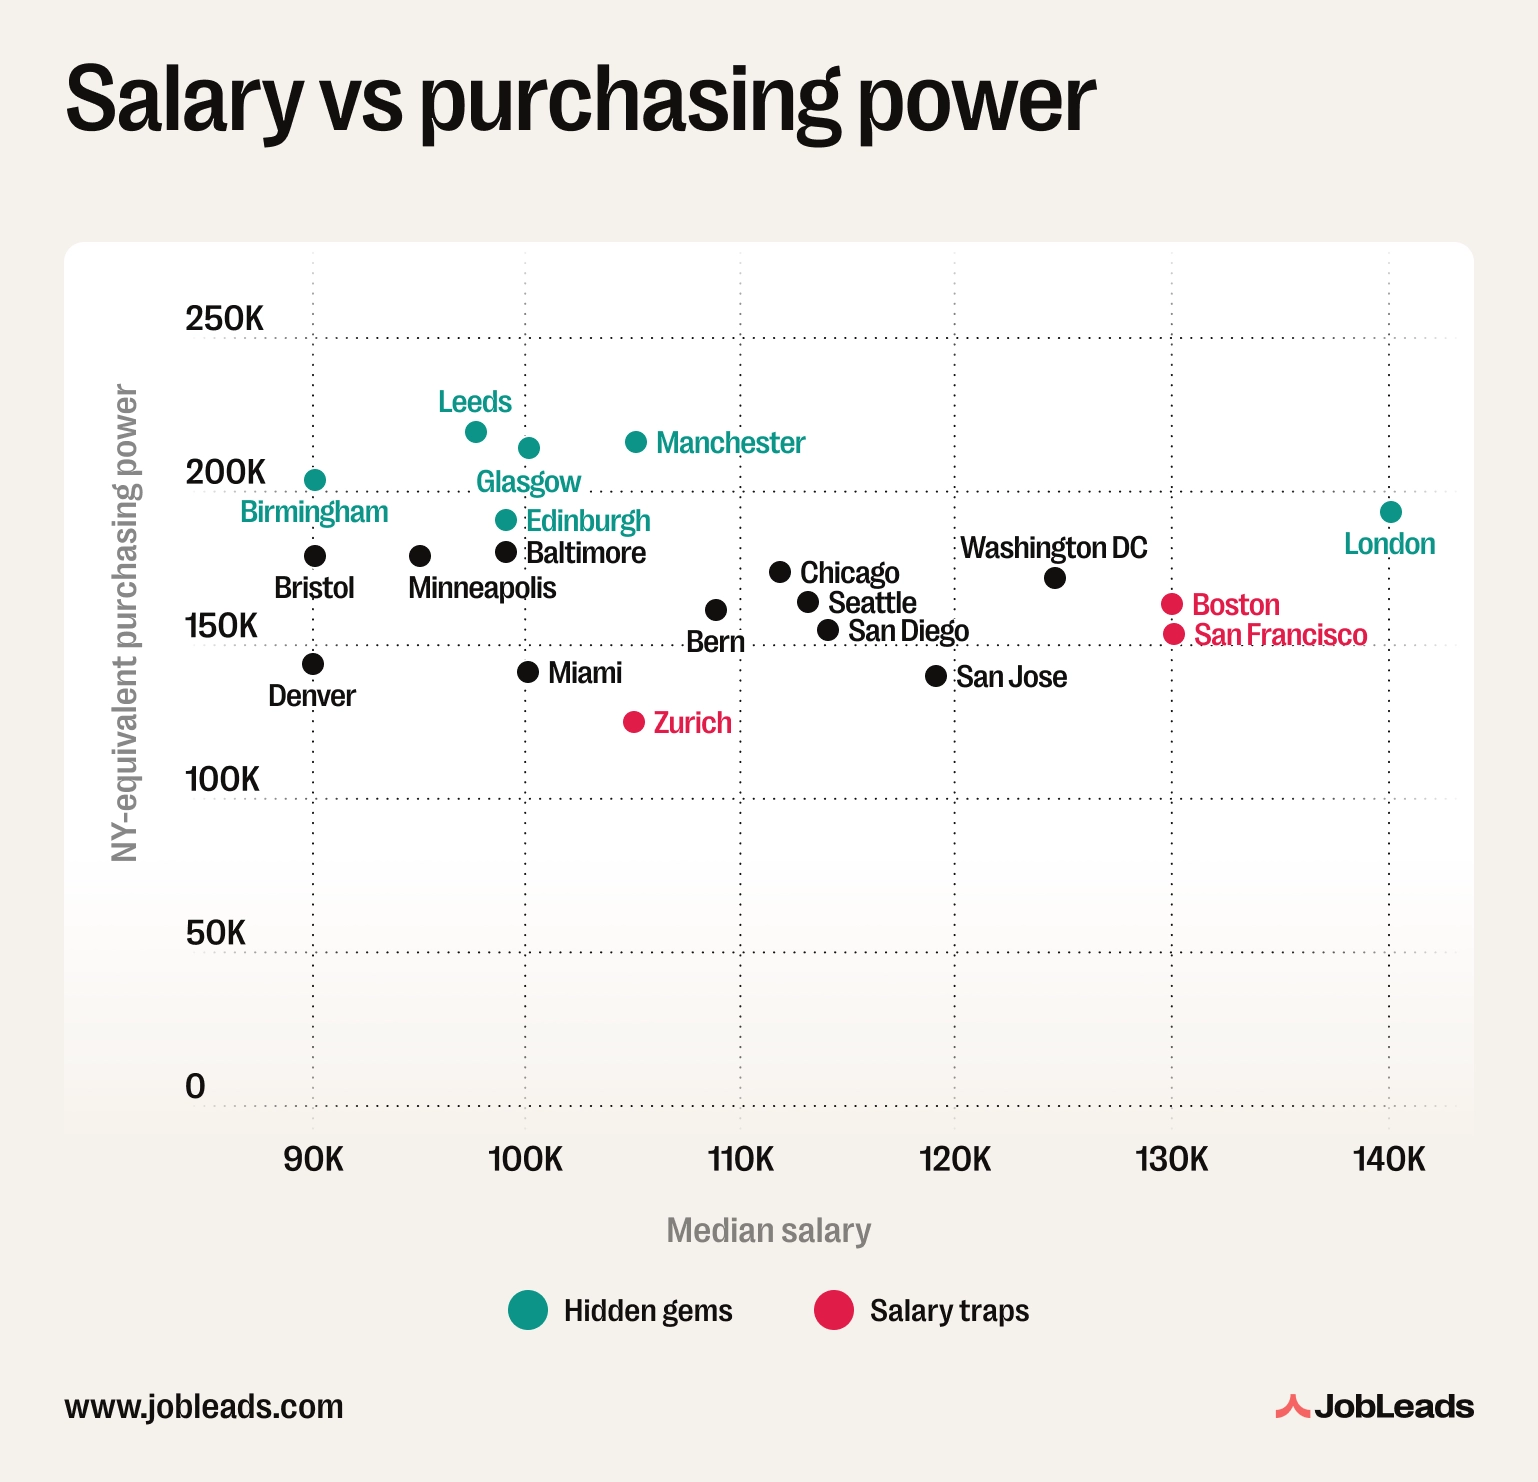
Mercer's Cost of Living City Ranking confirms the direction Numbeo shows. Mercer places the three Swiss cities (Zurich, Geneva, Basel) and Bern in its global top six, with London at #8 globally and ahead of every other European capital. The cities that appear as salary traps in the JobLeads dataset–Zurich, Bern and San Francisco–also sit near the top of Mercer's professional survey. This strengthens the case that headline salaries in these markets do less work for workers than the gross figures suggest.
Cost of living captures rent and goods. It does not capture income tax, which is where Continental Europe's high earners lose ground again. According to the OECD's Taxing Wages report, the average tax wedge for a single worker on the average wage was 35% across OECD countries, which is the highest reading in three years. Belgium (52.5%) and Germany (49%) lead the table; Colombia (0-39%) and Chile (8%) anchor the bottom.
The UK's tax wedge sits below the OECD average, which compounds the cost-of-living advantage shown above. UK workers in regional cities benefit from both lower goods/housing costs and a lower labour-tax burden than their German or Belgian counterparts. Switzerland's relatively low tax wedge partially offsets its punishing cost of living for Bern and Zurich, but not enough to bring either city back into the global top 10 on purchasing power.
Earlier JobLeads research on the salary gap between applicant expectations and posted market offers found that 99% of applicants expect more than employers post. This is a pattern that this dataset suggests is sharpest in the high-CoL cities where the gross figure no longer reflects what workers actually keep.
Within the US, the salary table is led by Boston ($130K) and San Francisco ($130K), closely followed by Washington DC ($125K) and the four Silicon Valley boutique markets of Palo Alto, Cupertino, Mountain View and Foster City ($125K each).
Here's a table of the top 10 highest-paying US cities:
| # | City | State | Median salary | Numbeo CoL+Rent Index (NY=100) | NY-equivalent purchasing power |
|---|---|---|---|---|---|
| 1 | Boston | MA | $130K | 80 | $162,700 |
| 2 | San Francisco | CA | $130K | 85 | $152,900 |
| 3 | Washington DC | DC | $125K | 74 | $170,100 |
| 4 | Palo Alto | CA | $125K | 85 (SV avg.) | $147,000 |
| 5 | Cupertino | CA | $125K | 85 (SV avg.) | $147,000 |
| 6 | Mountain View | CA | $125K | 85 (SV avg.) | $147,000 |
| 7 | Foster City | CA | $125K | 85 (SV avg.) | $147,000 |
| 8 | Miami | FL | $100K | 71 | $140,800 |
| 9 | Baltimore | MD | $99.4K | 55 | $180,000 |
| 10 | Minneapolis | MN | $95K | 53 | $178,600 |
Within the US, the salary-to-cost-of-living equation reshapes the ranking substantially.
Baltimore becomes the highest US city on purchasing power. It overtakes Boston, San Francisco and all four Silicon Valley boutique cities on what workers actually keep. Miami's high CoL relative to its $100K median drops it sharply down the table.
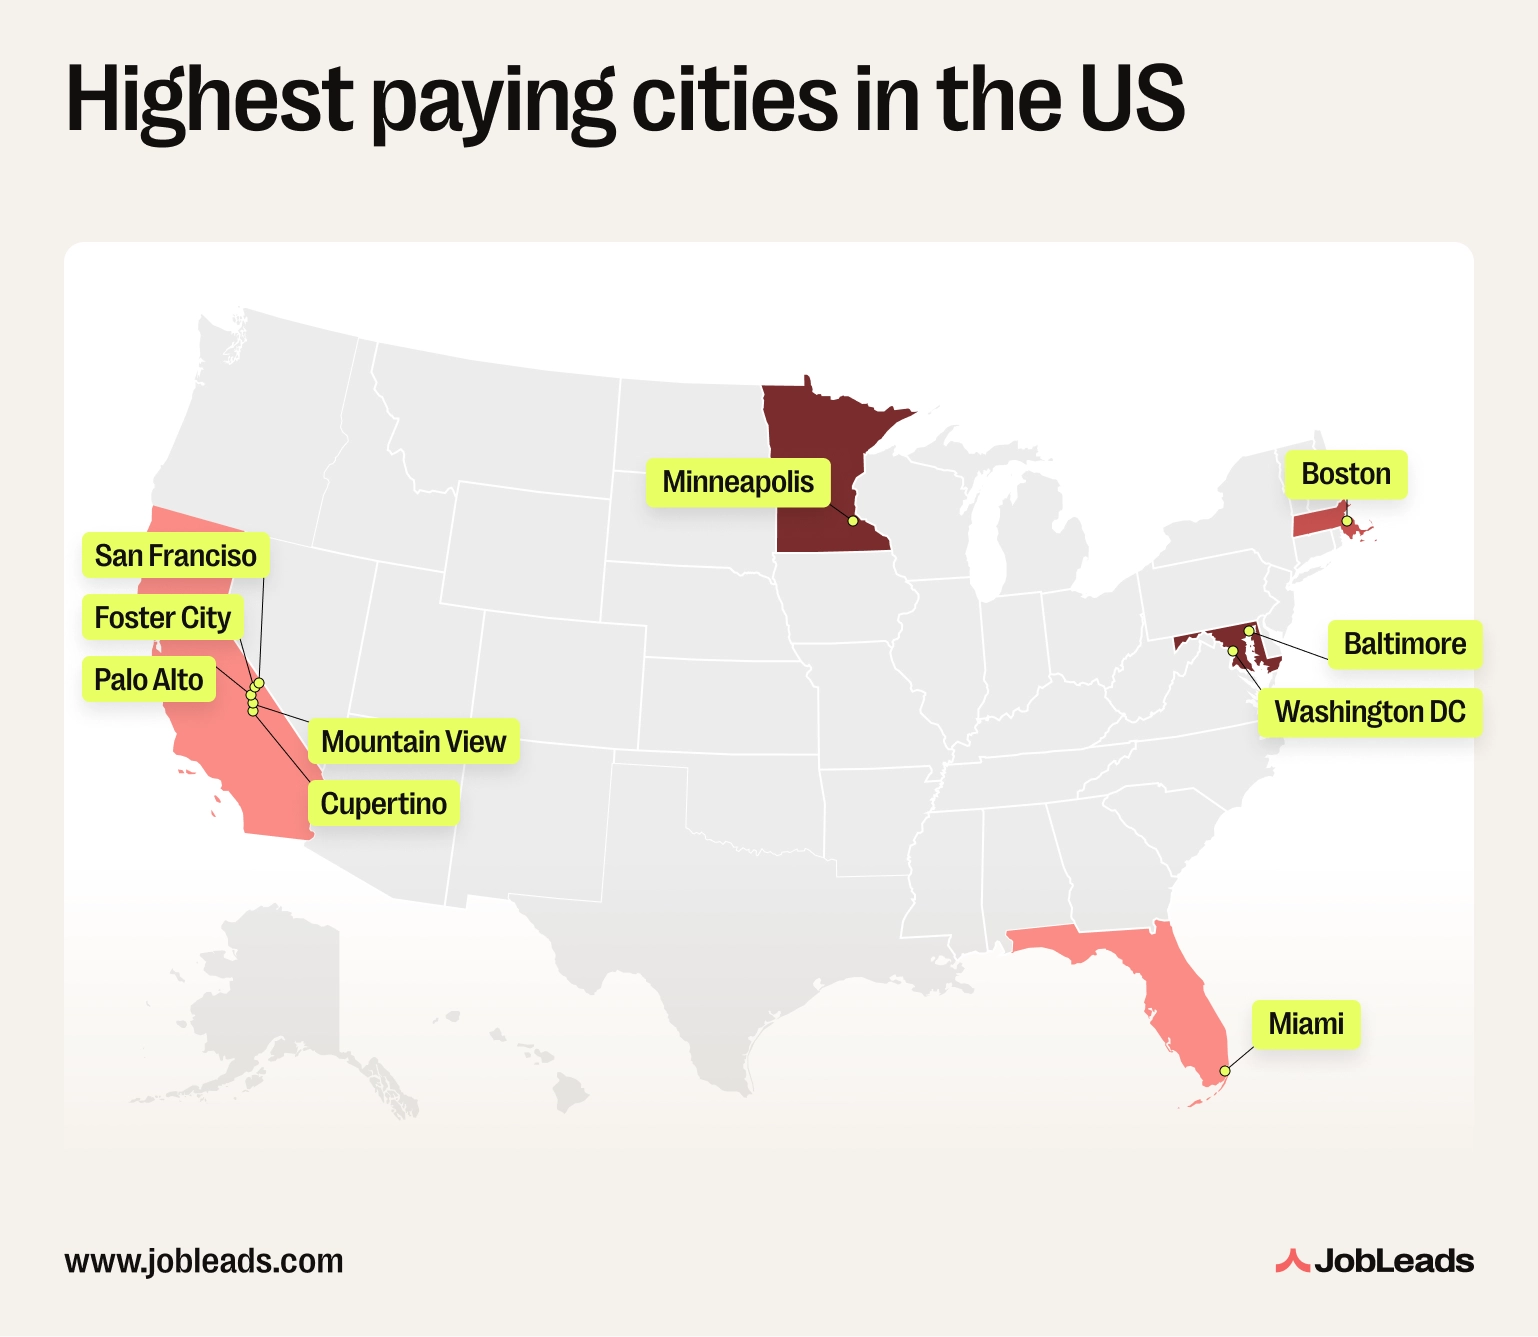
Highest-paying cities in Florida: Miami ($100K gross, $140K NY-equivalent) leads the state. Tampa and Orlando trail significantly behind, making Miami the clear answer to highest-paying cities in Florida.
Highest-paying cities in California: five Californian cities in the US top seven on gross salary–San Francisco, Palo Alto, Cupertino, Mountain View and Foster City–but none crack the US top six on purchasing power once the state's high cost of living is applied. California leads on gross pay, not on take-home value.
Highest-paying cities in Texas: Austin leads the state on remote-work share (46% remote per JobLeads data) but does not break the top 10 nationally on median salary. Houston's $90K-range median and 63% on-site share illustrate the energy sector's grip on the local labour market.
San Francisco and Cupertino sit 30 miles apart. Yet, they represent opposite ends of the US work-setting spectrum. San Francisco runs 44% remote and 37% on-site while Cupertino runs 80% on-site and 14% remote. Same region, opposite direction.
The pay gap between the two work modes is significant. In fact, a separate JobLeads analysis of remote vs on-site tech salaries puts the divide at $33,000 per year on average–a meaningful trade-off for workers weighing flexibility against headline pay.
The split is unlikely to close on its own. A JobLeads survey found that only 7% of fully remote workers would return to the office for a 5% pay rise. As many as 47% required a 20% raise, 23% required a 50% raise, and a further 23% said they would refuse regardless of the money on offer.
Almost half of the remote workforce will not accept any realistic salary uplift to return on-site. This means that cities where the dominant employers are software-driven (like San Francisco) and cities where the dominant employer is hardware-driven (like Cupertino) are likely to stay structurally split.
Raleigh, NC (54% remote) tops the US remote share, ahead of Austin (46%) and Denver (45%). Houston (63% on-site) and New York (53% on-site) anchor the on-site end.
| # | City | Remote | Hybrid | On-site |
|---|---|---|---|---|
| 1 | Raleigh, NC | 54% | 8% | 38% |
| 2 | Austin, TX | 46% | 12% | 42% |
| 3 | Denver, CO | 45% | 15% | 41% |
| 4 | San Francisco, CA | 44% | 19% | 37% |
| 5 | Boston, MA | 41% | 20% | 40% |
| 6 | Washington DC | 40% | 16% | 44% |
| 7 | Seattle, WA | 41% | 16% | 43% |
| 8 | Chicago, IL | 40% | 17% | 43% |
| 9 | New York, NY | 33% | 15% | 53% |
| 10 | Houston, TX | 27% | 10% | 63% |
| 11 | Cupertino, CA | 14% | 6% | 80% |
The single sharpest movement in the data is the UK's salary surge. Edinburgh recorded the largest year-on-year rise of any major city at +92%, from $50K to $100K. Leeds (+87%), Nottingham (+85%), Birmingham (+80%) and Leicester (+80%) all posted increases above 80%.
Three factors drove the UK rise: real pay growth in mid-tier cities, a stronger pound against the dollar in 2025, and a shift in which jobs employers advertised with a salary attached.
At the other end of the table, San Francisco fell 23%, from $165K to $130K. This is the steepest decline of any major city in the dataset. Alexandria, VA (-21%), New Orleans (-17%), Columbia (-15%) and Wilmington (-14%) followed. The pattern is concentrated in US cities exposed either to the tech labour-market correction or to public-sector contract pay shifts.
Where to work in 2026 depends on what you're optimizing for. If gross salary is the goal, US tech corridors still pay the most. San Jose's $119K median posted salary is a city-specific premium that doesn't travel with you, and a strategic job hop into the city is often the fastest way to access it.
If purchasing power is the goal, the UK regional capitals win. Leeds, Manchester, Glasgow and Birmingham deliver more NY-equivalent buying power than London, Boston, San Francisco or any Swiss city.
And if remote work is on the table, a San Francisco salary in Raleigh's cost base is a different proposition.
What was analyzed. Approximately 130 million salaried job postings across 42 countries and 150 major cities, posted between January and December 2025 (JobLeads platform data), combined with three external datasets: the Numbeo Cost of Living Index 2025, the OECD Taxing Wages 2025 report, and the US Bureau of Labor Statistics Occupational Employment and Wage Statistics (OEWS) May 2024 release. The combined dataset allows users to compare salary by city, by profession and by purchasing power, and reports average salary by city for every market that meets the minimum posting threshold.
Dataset definition. Jobs are classified by posted location. Salary equals posted compensation, not negotiated offers or total compensation. Cities are included only where ≥1,000 postings were recorded in the analysis period; profession-level analysis requires ≥50,000 postings. All JobLeads salaries are converted to USD using 2025 full-year average exchange rates via a EUR bridge.
Outlier treatment. Postings above the 95th percentile per country are removed before computing medians, to prevent extreme listings from skewing the rankings.
Year-on-year comparison. Cities must appear in both 2024 and 2025 to enter the YoY change table. Cities with posting-volume shifts greater than 2× year-on-year are excluded to avoid composition-shift artifacts.
Application rate. Defined as applies divided by (clicks + applies), expressed as a percentage. Measures intent per interaction, not per user and not per job listing.
Purchasing-power calculation. NY-equivalent purchasing power = JobLeads median salary (USD) ÷ (Numbeo Cost of Living Plus Rent Index ÷ 100), where New York = 100. This is a modelled estimate. It does not adjust for income tax (covered separately via OECD Taxing Wages 2025) and does not capture individual lifestyle variation.
Currency conversion. UK figures converted at approximately £1 = $1.25 (2025 average); Swiss figures at approximately CHF 1 = $1.10 (2025 average). Source: ECB and Federal Reserve historical rates.
Limitations:
Minimum thresholds. Cities included only where ≥1,000 job postings were recorded. Profession-level tables filtered to cities with ≥50,000 postings per role category. Major-market chart filtered to ≥50,000 total postings.
This research is published by JobLeads for editorial and public-interest reporting. Journalists and analysts are welcome to cite findings, charts and data points with attribution to JobLeads and a link to this article. For raw data requests, methodology questions, or expert interviews, contact press@jobleads.com.

Content & Insight Writer
Beata creates content that puts job seekers first. From practical blog advice to first-hand research studies, her writing is designed to give people the clarity and confidence to find the role they deserve.
Job Market TrendsJobLeads study on 811K job postings and 245K professionals reveals the differences in workers' salary expectations and wages offered by employers.
 Job Market Trends
JobLeads analyzed behavioral data from 881,776 U.S. job seekers to better understand how the gender pay gap develops throughout the job search process. The study finds that women ultimately earn 83 cents for every dollar men earn, but that difference is shaped long before a paycheck is issued.
 Job Market Trends
Is remote work costing you thousands? JobLeads' study of 42 tech roles reveals who wins and loses in the remote salary game–and how to minimize the cuts.