
 Job Market Trends
April 21, 2026
The Salary Gap: 99% of Applicants Expect More Than Market Offers
JobLeads study on 811K job postings and 245K professionals reveals the differences in workers' salary expectations and wages offered by employers.


Most employers think a longer benefits section attracts more candidates.
But, the data says otherwise.
JobLeads analyzed 60 million US job listings from 2025. The research aimed to find out which perks actually drive applications, which quietly turn candidates away, and why most employee benefits sections are doing the opposite of what employers want.
The findings reveal a broken benefits-section economy–and a few clear patterns for what genuinely works.
Let’s dive deeper into our findings:
Not every job offers any perks. How many do so?
JobLeads' analysis found that 69% mention at least one benefit. Yet, the presence of a benefits section is not, by itself, a positive signal of such jobs attracting job seekers.
In fact, many jobs that list perks convert worse than those listing none at all. Job ads that don’t mention any benefits convert into applications at a 48% rate. The interesting part is that listings with 1-2 perks achieve a 42% apply-click rate. Adding more perks narrows the gap but doesn't close it: 3-5 perks reaches 43%, still 5% below jobs that list nothing.
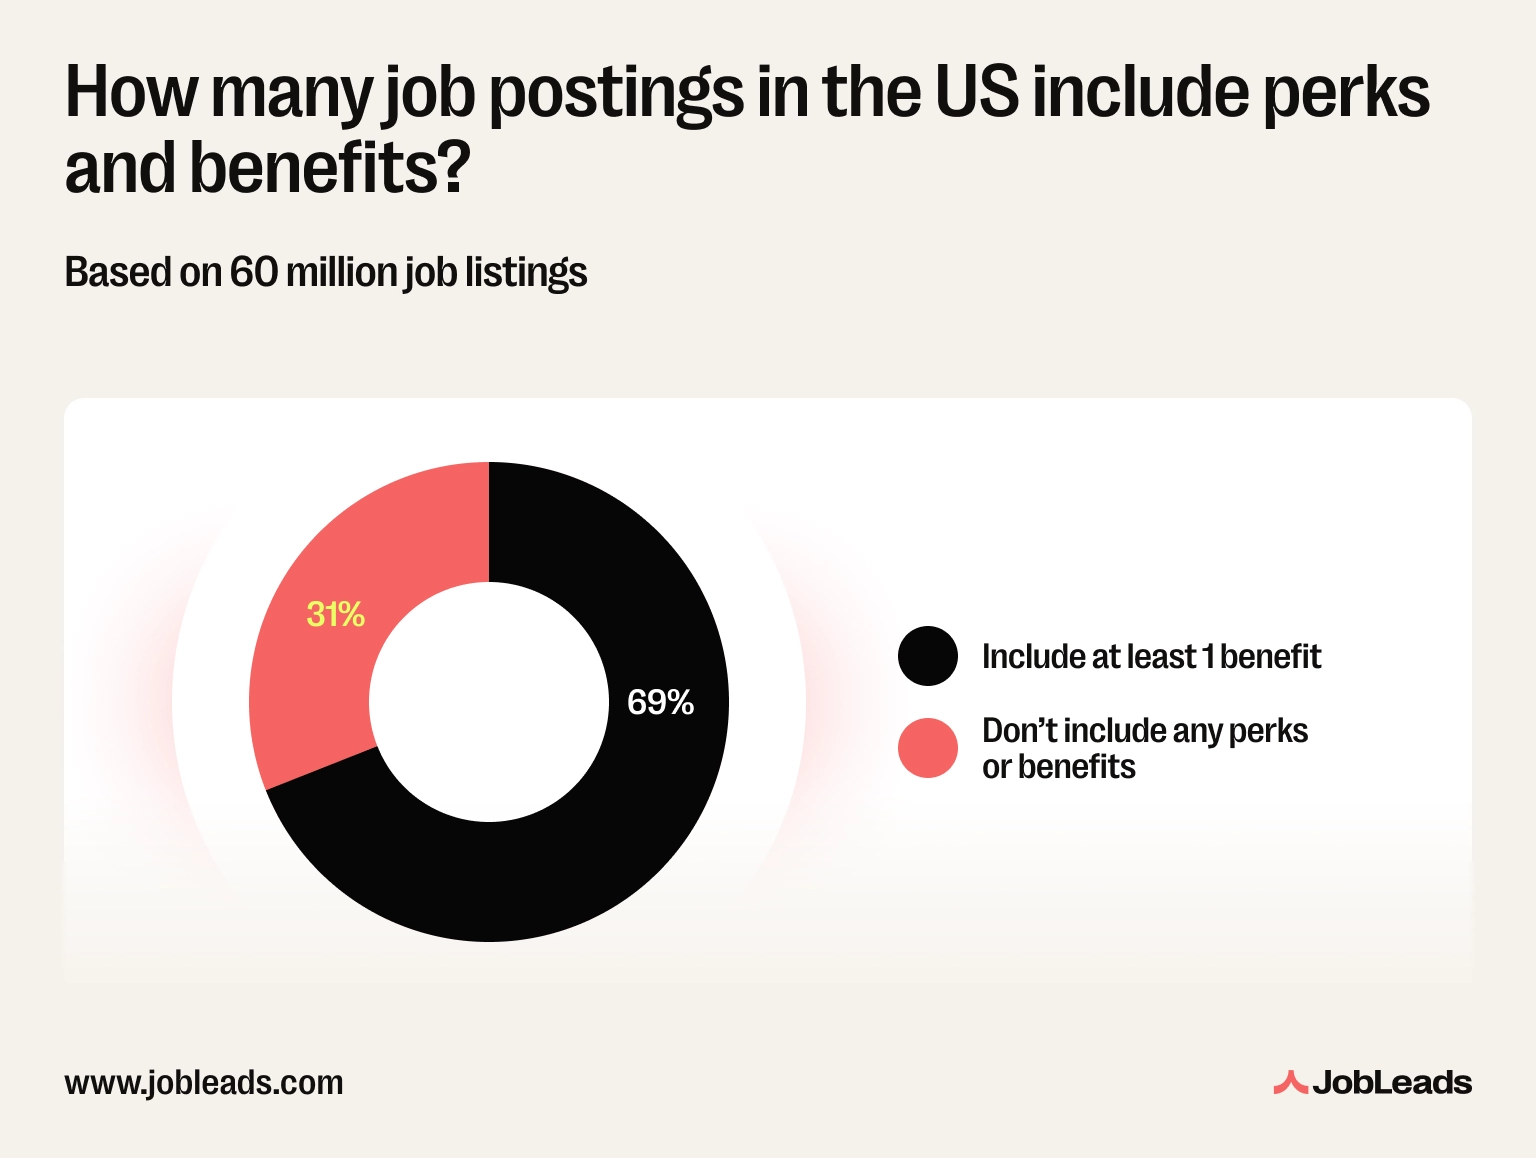
The data shows a U-shaped curve, not a linear one. Interestingly, jobs that mention 1-5 perks attract less applicants than those that mention no benefits at all.
This penalty only disappears at 6+ perks in a listing. Postings with 6-8 perks reach 50%, and those with 9+ reach 52%–both above the no-perks baseline.
The implication here is counterintuitive: a short benefits section is worse than no benefits section. This likely reflects how candidates read listings. In fact, research by the Nielsen Norman Group on how users scan web content consistently shows that people skim rather than read.
So, a brief, familiar-looking bullet list of standard benefits (health insurance, paid time off, etc.) is processed and dismissed faster than a section that doesn't exist at all. An absent benefits section raises no expectations, whereas listing bare minimum perks answers the question “what does this employer offer?” with a disappointing answer.
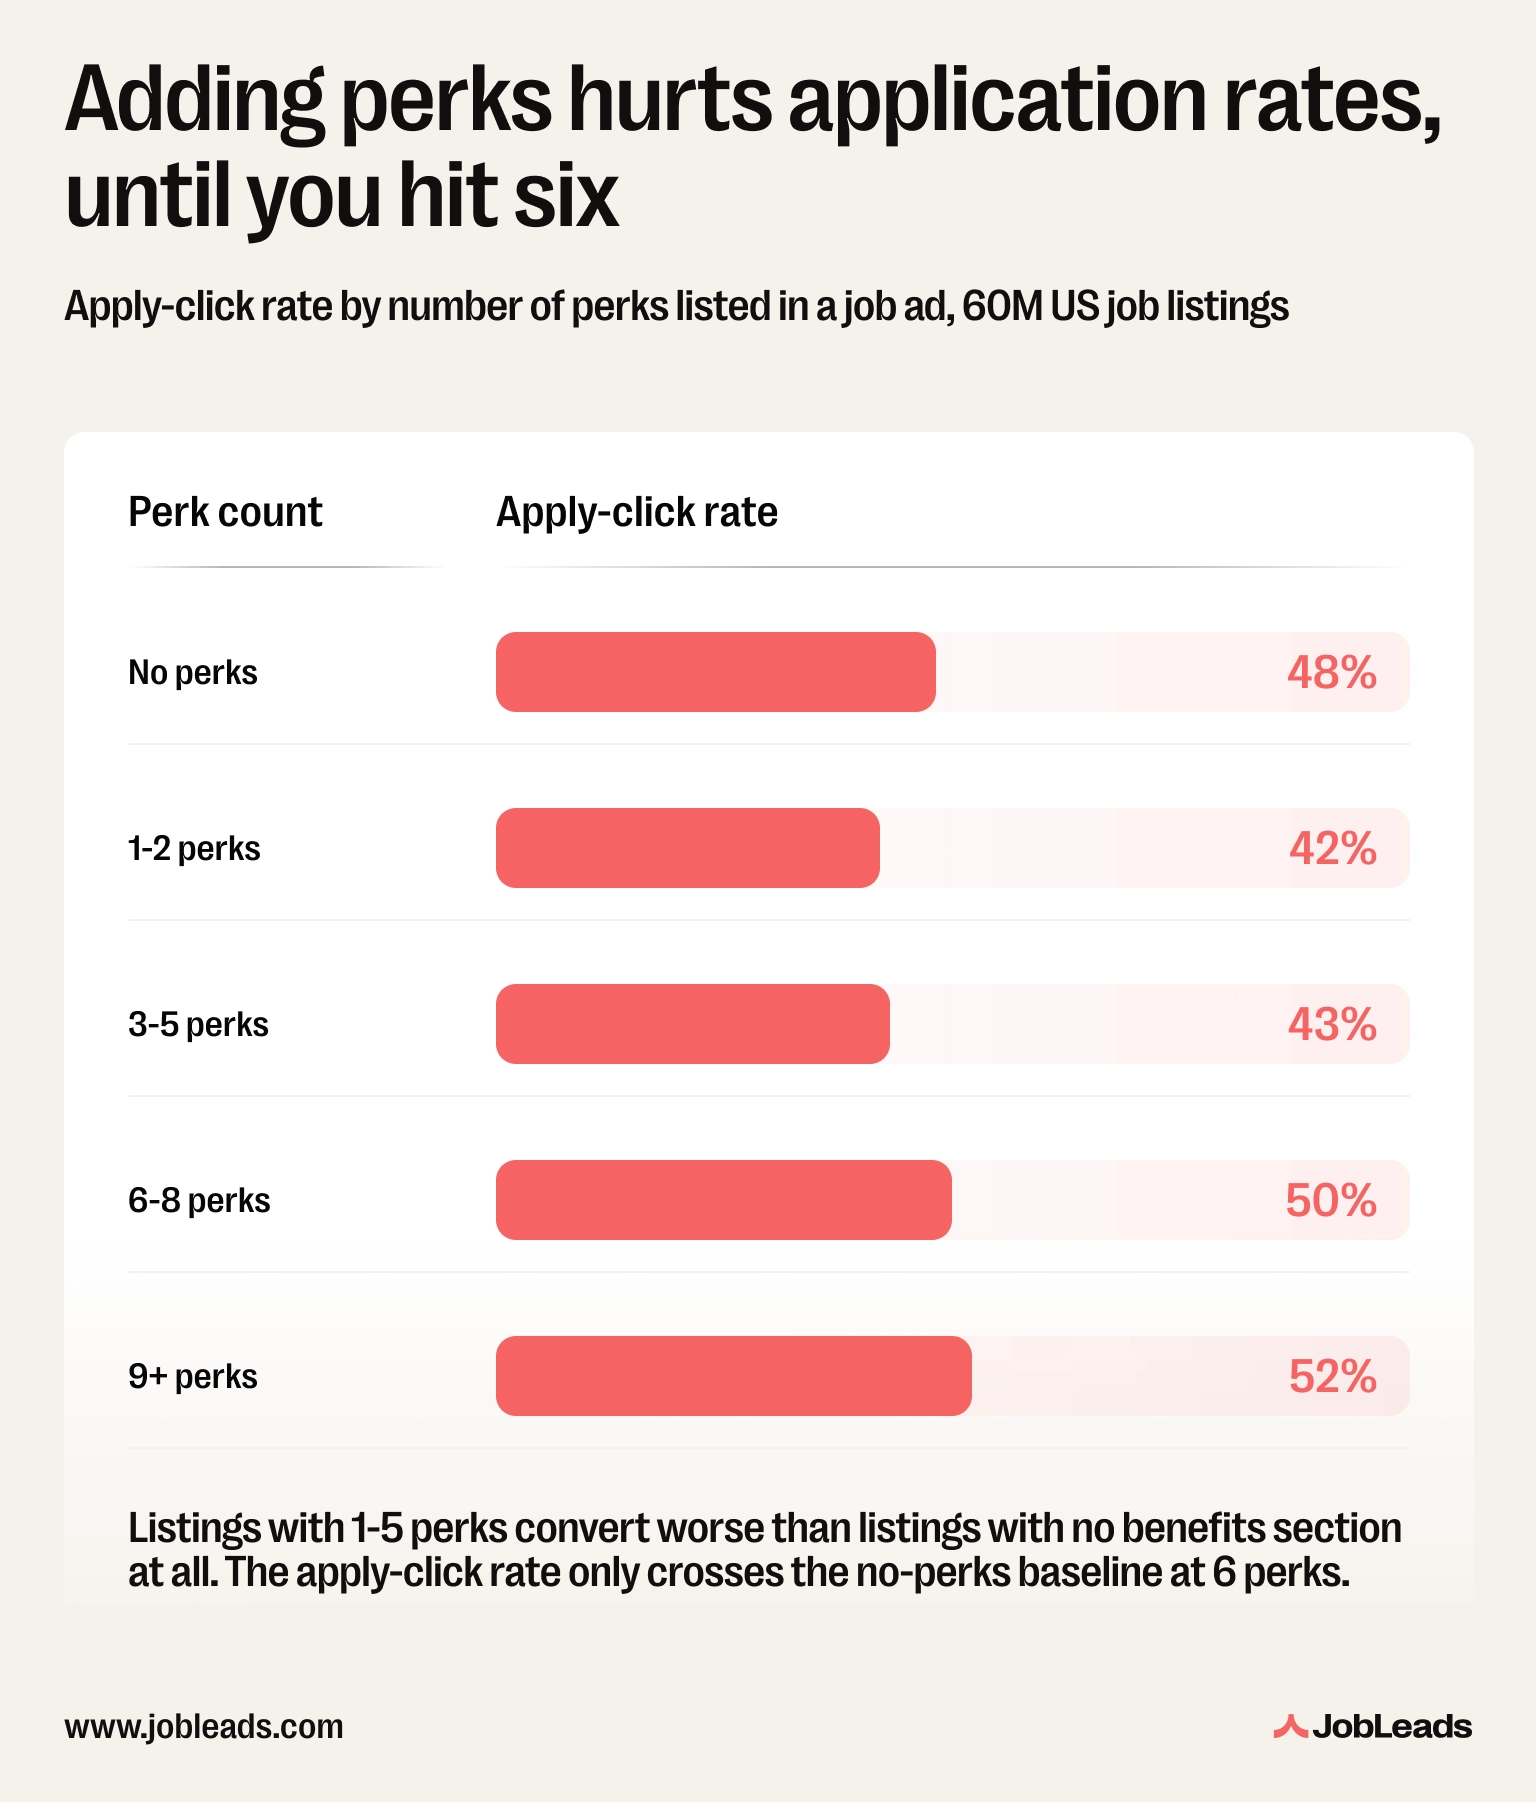
Six perks is not a magic number though. Instead, it is a threshold at which the benefits section becomes substantial enough to function as differentiation rather than box-ticking. Below it, the signal is just noise.
Perks aren't a uniform tool. The lower the salary, the harder a benefits section works, and the difference between low-paid and high-paid roles is dramatic.
For the lowest-paid quarter of US jobs, listings with 6 or more perks hit an 88% apply-click rate. That's the highest engagement number anywhere in the dataset, and 19 points above the same low-salary jobs that list no perks at all (69%). And on top of applying to these listings, candidates are also saving them at more than 20 times the rate of high-salary jobs–bookmarking them as goals rather than just scrolling past.
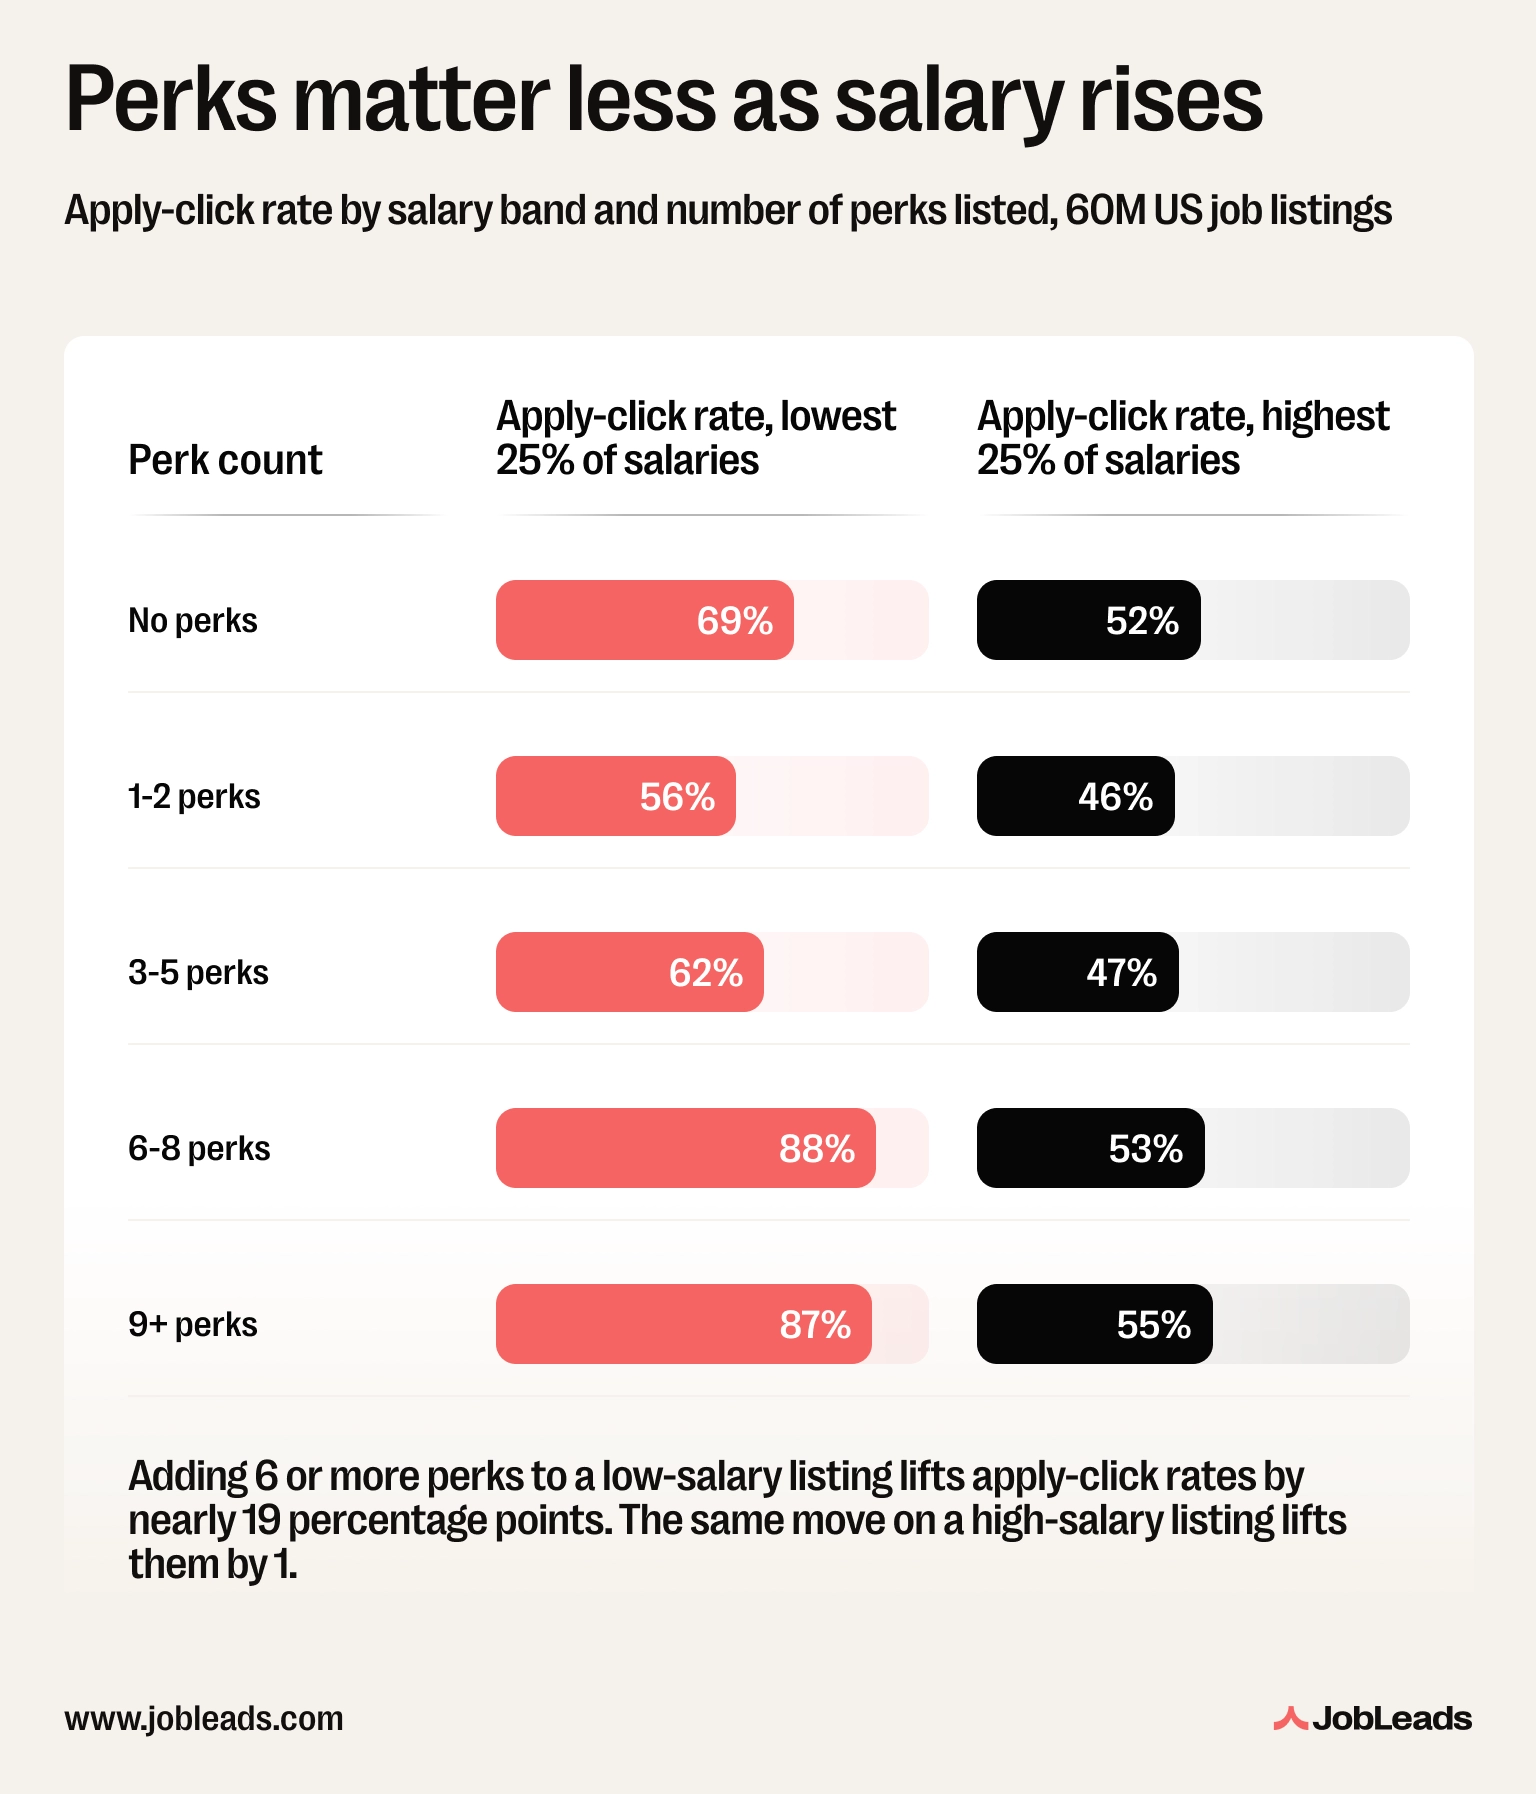
For the highest-paid quarter of US jobs, the same move barely registers. Going from no perks to 6+ perks lifts apply-click rates from 52% to 53%–just a single percentage point.
The reason is intuitive. Perks act as partial wage substitutes, and each one carries more weight against a smaller paycheck. Employee discounts, gym access, or extra PTO matter more to someone earning $35K than to someone earning $200K.
Bottom line–for low-salary listings, a strong benefits section is one of the highest-leverage moves an employer can make. At the top of the pay scale, it's mostly window dressing.
What benefits job seekers prioritize is an individual thing. Are there any patterns in how Americans assess perks in job descriptions?
Bare minimum perks essentially mean those generally limited to legal requirements (statutory rights) or basic functional necessities, rather than real employee incentives. These often include standard annual leave, statutory sick pay, and essential tools like laptops or on-site parking. Token benefits can also include things that would generally be considered basic workplace decency rather than a perk, like “a great team culture”, “free coffee”, “friendly office”, or “no overtime work.”
The 5-point gap between listings with shiny-but-shallow benefits and listings with no benefits at all is a consistent pattern, and the specific perks driving it are identifiable.
Health Insurance appears in 43% of US job listings and delivers +2% uplift. Pension/401(k), listed by 41% of employers, delivers -0.1%–statistically indistinguishable from zero. Annual Bonus drives -3.9%. L&D Budget, which many employers position as a forward-looking benefit, delivers -0.6% at entry level and -1.4% at mid-level.
In aggregate, a benefits section composed entirely of these “bare minimum” entries signals something candidates interpret negatively, e.g., that nothing genuinely differentiating is on offer.
Turns out that benefits that aren’t really benefits harms companies’ recruiting efforts and reputation.
Employee Discounts are not an obvious candidate for the most impactful perk in a 60-million-listing dataset. Yet, across all sectors, all seniority levels, and all contract types, they produce +18% engagement uplift. The increase is nearly 4x the next-best perk, Extra PTO, at +4%.
The difference between these and the zero-uplift perks is the scarcity signal. When a perk appears in 43% of listings, its presence tells a candidate nothing about the employer and company culture. When it appears in 7%, it does.
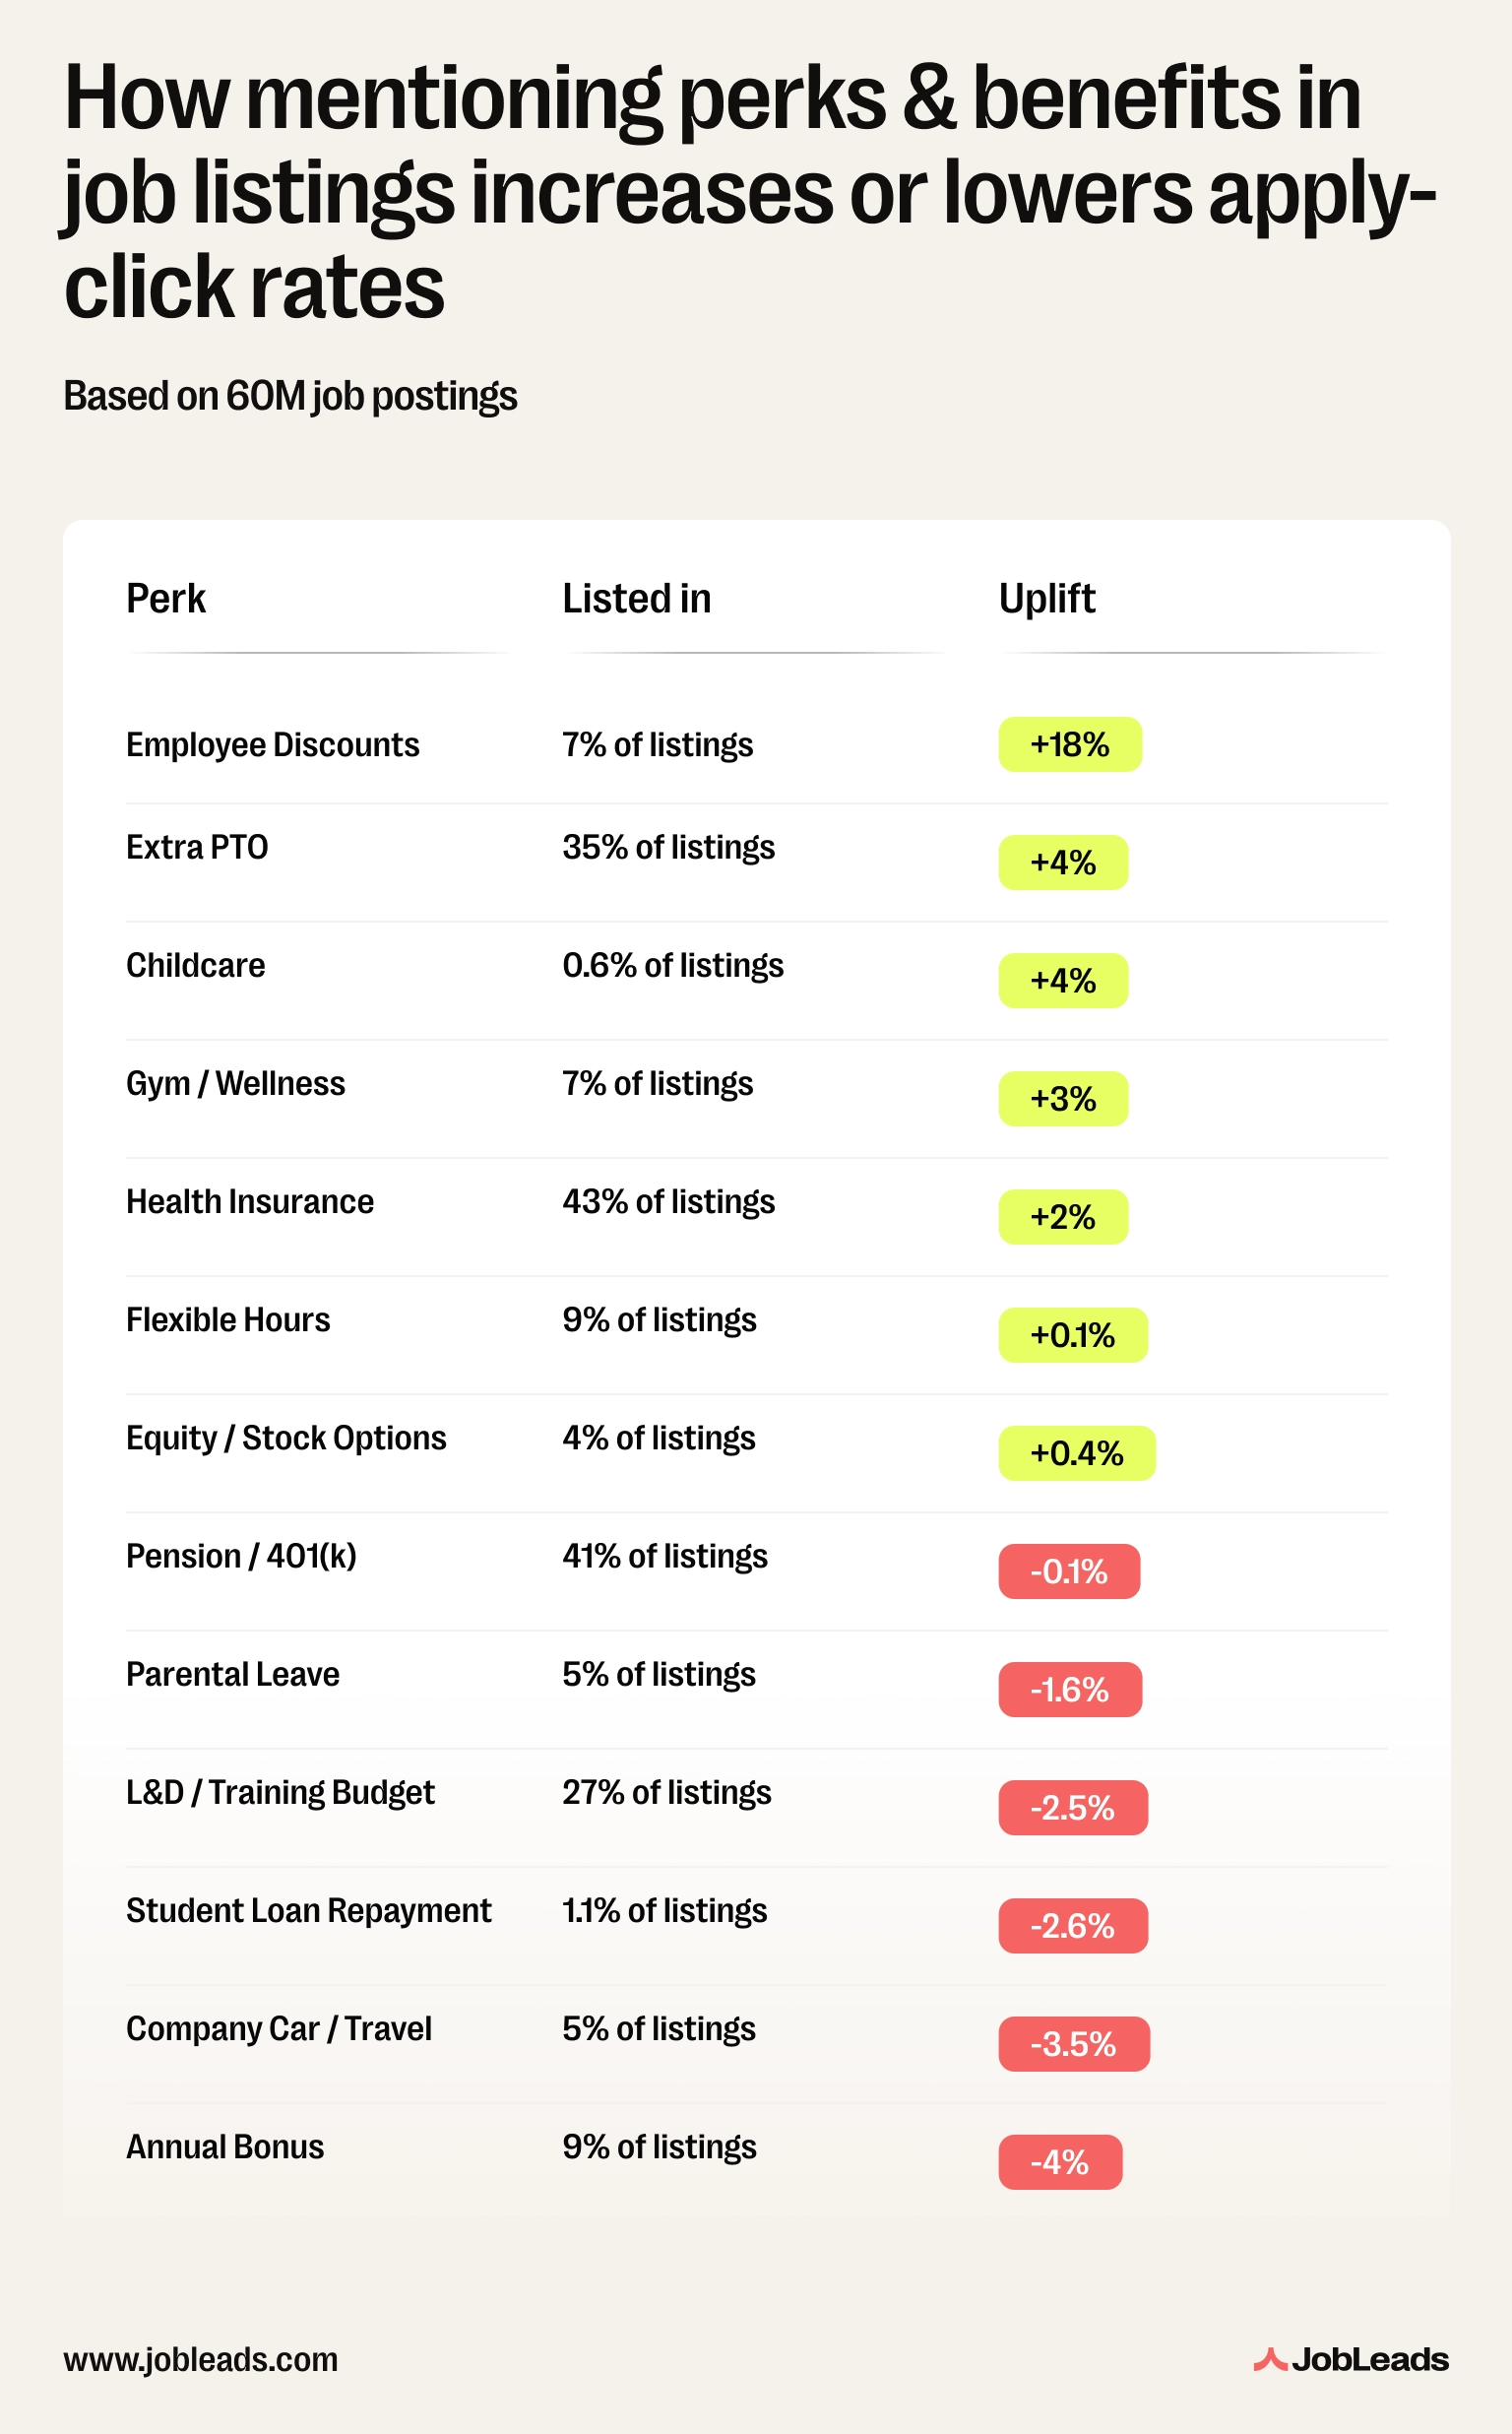
Perks work in different ways for different types of job seekers. Let’s take a look at how people of different seniority levels and work mode preferences react to perks in listings.
Equity and stock options don't land evenly across a career. Mid-level professionals respond to them harder than any other group responds to any other perk in the entire dataset.
For mid-level candidates, listings that mention Equity drive a 23% uplift in apply-clicks. Entry-level candidates show a +15% lift on the same perk. Senior candidates show just +5%.
The split lines up with how compensation works at each stage. Entry-level candidates tend to prioritize cash and stability: for them, Equity is often quite abstract. On the opposite end, Senior candidates might already hold significant unvested equity at their current employer and would forfeit it by switching. So, it makes a new equity grant feel less like a gain and more like a wash. Mid-level professionals sit in the gap between those two: experienced enough to be actively recruited, but not yet locked into vesting schedules they can't afford to walk away from.
The numbers around mid-career job movement reinforce this. According to Hays, workers who switch jobs typically see pay jumps of 10-20%, compared to 3-5% annual raises for those who stay put. And mid-career is when this game is played most aggressively. It's also the stage where equity stops being a footnote and starts being a real number. For a candidate weighing two offers in their thirties, equity is often the line item that decides which offer wins.
Interestingly, entry-level candidates respond most strongly to perks employers rarely associate with junior hires. Employee Discounts drive a +19% uplift, Stock Options +15%, and Company Car +11%–the three highest-performing perks for this group.
What's striking is what doesn't work. L&D and Training Budget, the perk most often positioned as a junior-facing benefit and built into employer branding aimed at early-career talent, drives a -0.6% uplift at entry-level. Despite appearing in 27% of US job listings, it ranks 9th of 14 perks for the very group it's supposedly designed to attract.
What entry-level candidates actually respond to:
| Perk | Uplift |
|---|---|
| Employee Discounts | +19% |
| Equity / Stock Options | +15% |
| Company Car / Travel | +11% |
| Gym / Wellness | +9% |
| Extra PTO | +9% |
| Remote / Flexible Working | +4% |
| Health Insurance | +2% |
| Pension / 401(k) | +1.4% |
| L&D / Training Budget | -0.6% |
| Flexible Hours | -0.8% |
| Parental Leave | -6% |
| Annual Bonus | -8% |
| Childcare | -18% |
| Student Loan Repayment | -25% |
The likely reason is signalling. Entry-level candidates have spent many recent years in classrooms, so “training and development” reads less like a benefit and more like a continuation of school. It also tends to appear in listings without specifics (no programs named, no mentorship structure, just L&D), which makes it indistinguishable from filler text.
By contrast, employee discounts, stock options, and a company car are concrete, immediately useful, and visibly differentiating. They tell a candidate the employer is offering something real, not just box-ticking the “professional growth” line.
Student loan repayment is the most extreme version of this pattern. Often pitched as a Gen Z-specific benefit and a top recruiting tool for early-career talent, it drives a -25% uplift at entry-level, making it the worst-performing perk for any group at any seniority level anywhere in the dataset. Childcare follows at -18%.
The takeaway here is that the benefits employers reach for when targeting entry-level talent are, statistically, the ones driving entry-level candidates away.
For senior candidates, perks barely register. The most effective perk in the entire benefits taxonomy (Employee Discounts) drives a +10% uplift at this level. The least effective, Student Loan Repayment, drives -5.4%. The full range from best to worst is 15 percentage points, less than half the spread seen at mid-level (37 points) and a third of the entry-level spread (43 points).
Lifestyle perks do matter for senior talent. Employee Discounts, Gym/Wellness (+8%), and Remote/Flexible Working (+7%) lead the rankings. Equity/Stock Options, aka the standout perk for mid-level candidates at +23%, drops to +5% at senior level, ranking fourth. Annual Bonus goes negative (-0.7%), and L&D/Training Budget continues its run as one of the worst-performing perks at every seniority tier.
What perks and benefits senior candidates actually respond to:
| Perk | Uplift |
|---|---|
| Employee Discounts | +10% |
| Gym / Wellness | +8% |
| Remote / Flexible Working | +7% |
| Equity / Stock Options | +5% |
| Parental Leave | +5% |
| Extra PTO | +2% |
| Health Insurance | +1% |
| Pension / 401(k) | +0.5% |
| Annual Bonus | -0.7% |
| Flexible Hours | -2% |
| Company Car / Travel | -2% |
| L&D / Training Budget | -3% |
| Childcare | -4% |
| Student Loan Repayment | -5% |
The likely explanation is that senior candidates have already solved the financial problems perks are designed to address. What changes their behavior is quality-of-life signalling: a gym, a remote-work option, an employee discount that suggests the employer treats people as adults rather than line items. Senior professionals also tend to stay in their roles longer and switch less frequently than mid-career talent, which means the listing has to clear a higher bar of differentiation just to capture attention in the first place.
The strongest perk on a remote job listing is the listing telling candidates the job is actually remote. Mentioning “remote/flexible working” in the benefits section of an already-remote posting drives a +12% uplift, which is the highest of any perk on remote listings, and well ahead of the next-best (Childcare at +8%, Employee Discounts at +6%). So, remote work is the strongest benefit even in already remote positions.
This is a quirk of how candidates read job ads. A remote tag at the top of a listing is no longer a strong signal, because over the past three years, the share of fully remote roles has dropped sharply. Also, many “remote” postings have turned out to mean hybrid, tied to a specific city, or remote-with-frequent-travel. Job seekers have grown skeptical enough that they now actively validate flexibility claims before applying.
Benefits that matter in remote listings:
| Perk | Uplift |
|---|---|
| Remote / Flexible Working | +12% |
| Childcare | +8% |
| Employee Discounts | +6% |
| Flexible Hours | +4% |
| Equity / Stock Options | +1% |
| Extra PTO | +0.9% |
| L&D / Training Budget | -0.8% |
| Health Insurance | -1% |
| Gym / Wellness | -2% |
| Parental Leave | -3% |
| Pension / 401(k) | -3% |
| Annual Bonus | -5% |
| Student Loan Repayment | -8% |
| Company Car / Travel | -19% |
The pattern is consistent: perks that make sense for an office worker but read as misaligned for a remote candidate actively reduce engagement.
Bottom line for employers: repeating “remote” in the benefits section beats every other perk.
Did you know…
According to JobLeads’ research on remote work, only 6% of jobs in the United States are fully remote. So, reaffirming flexibility in the benefits section is extra valued by job seekers.
Now, let’s zoom in on how candidates’ reaction to perks varies geographically in the US.
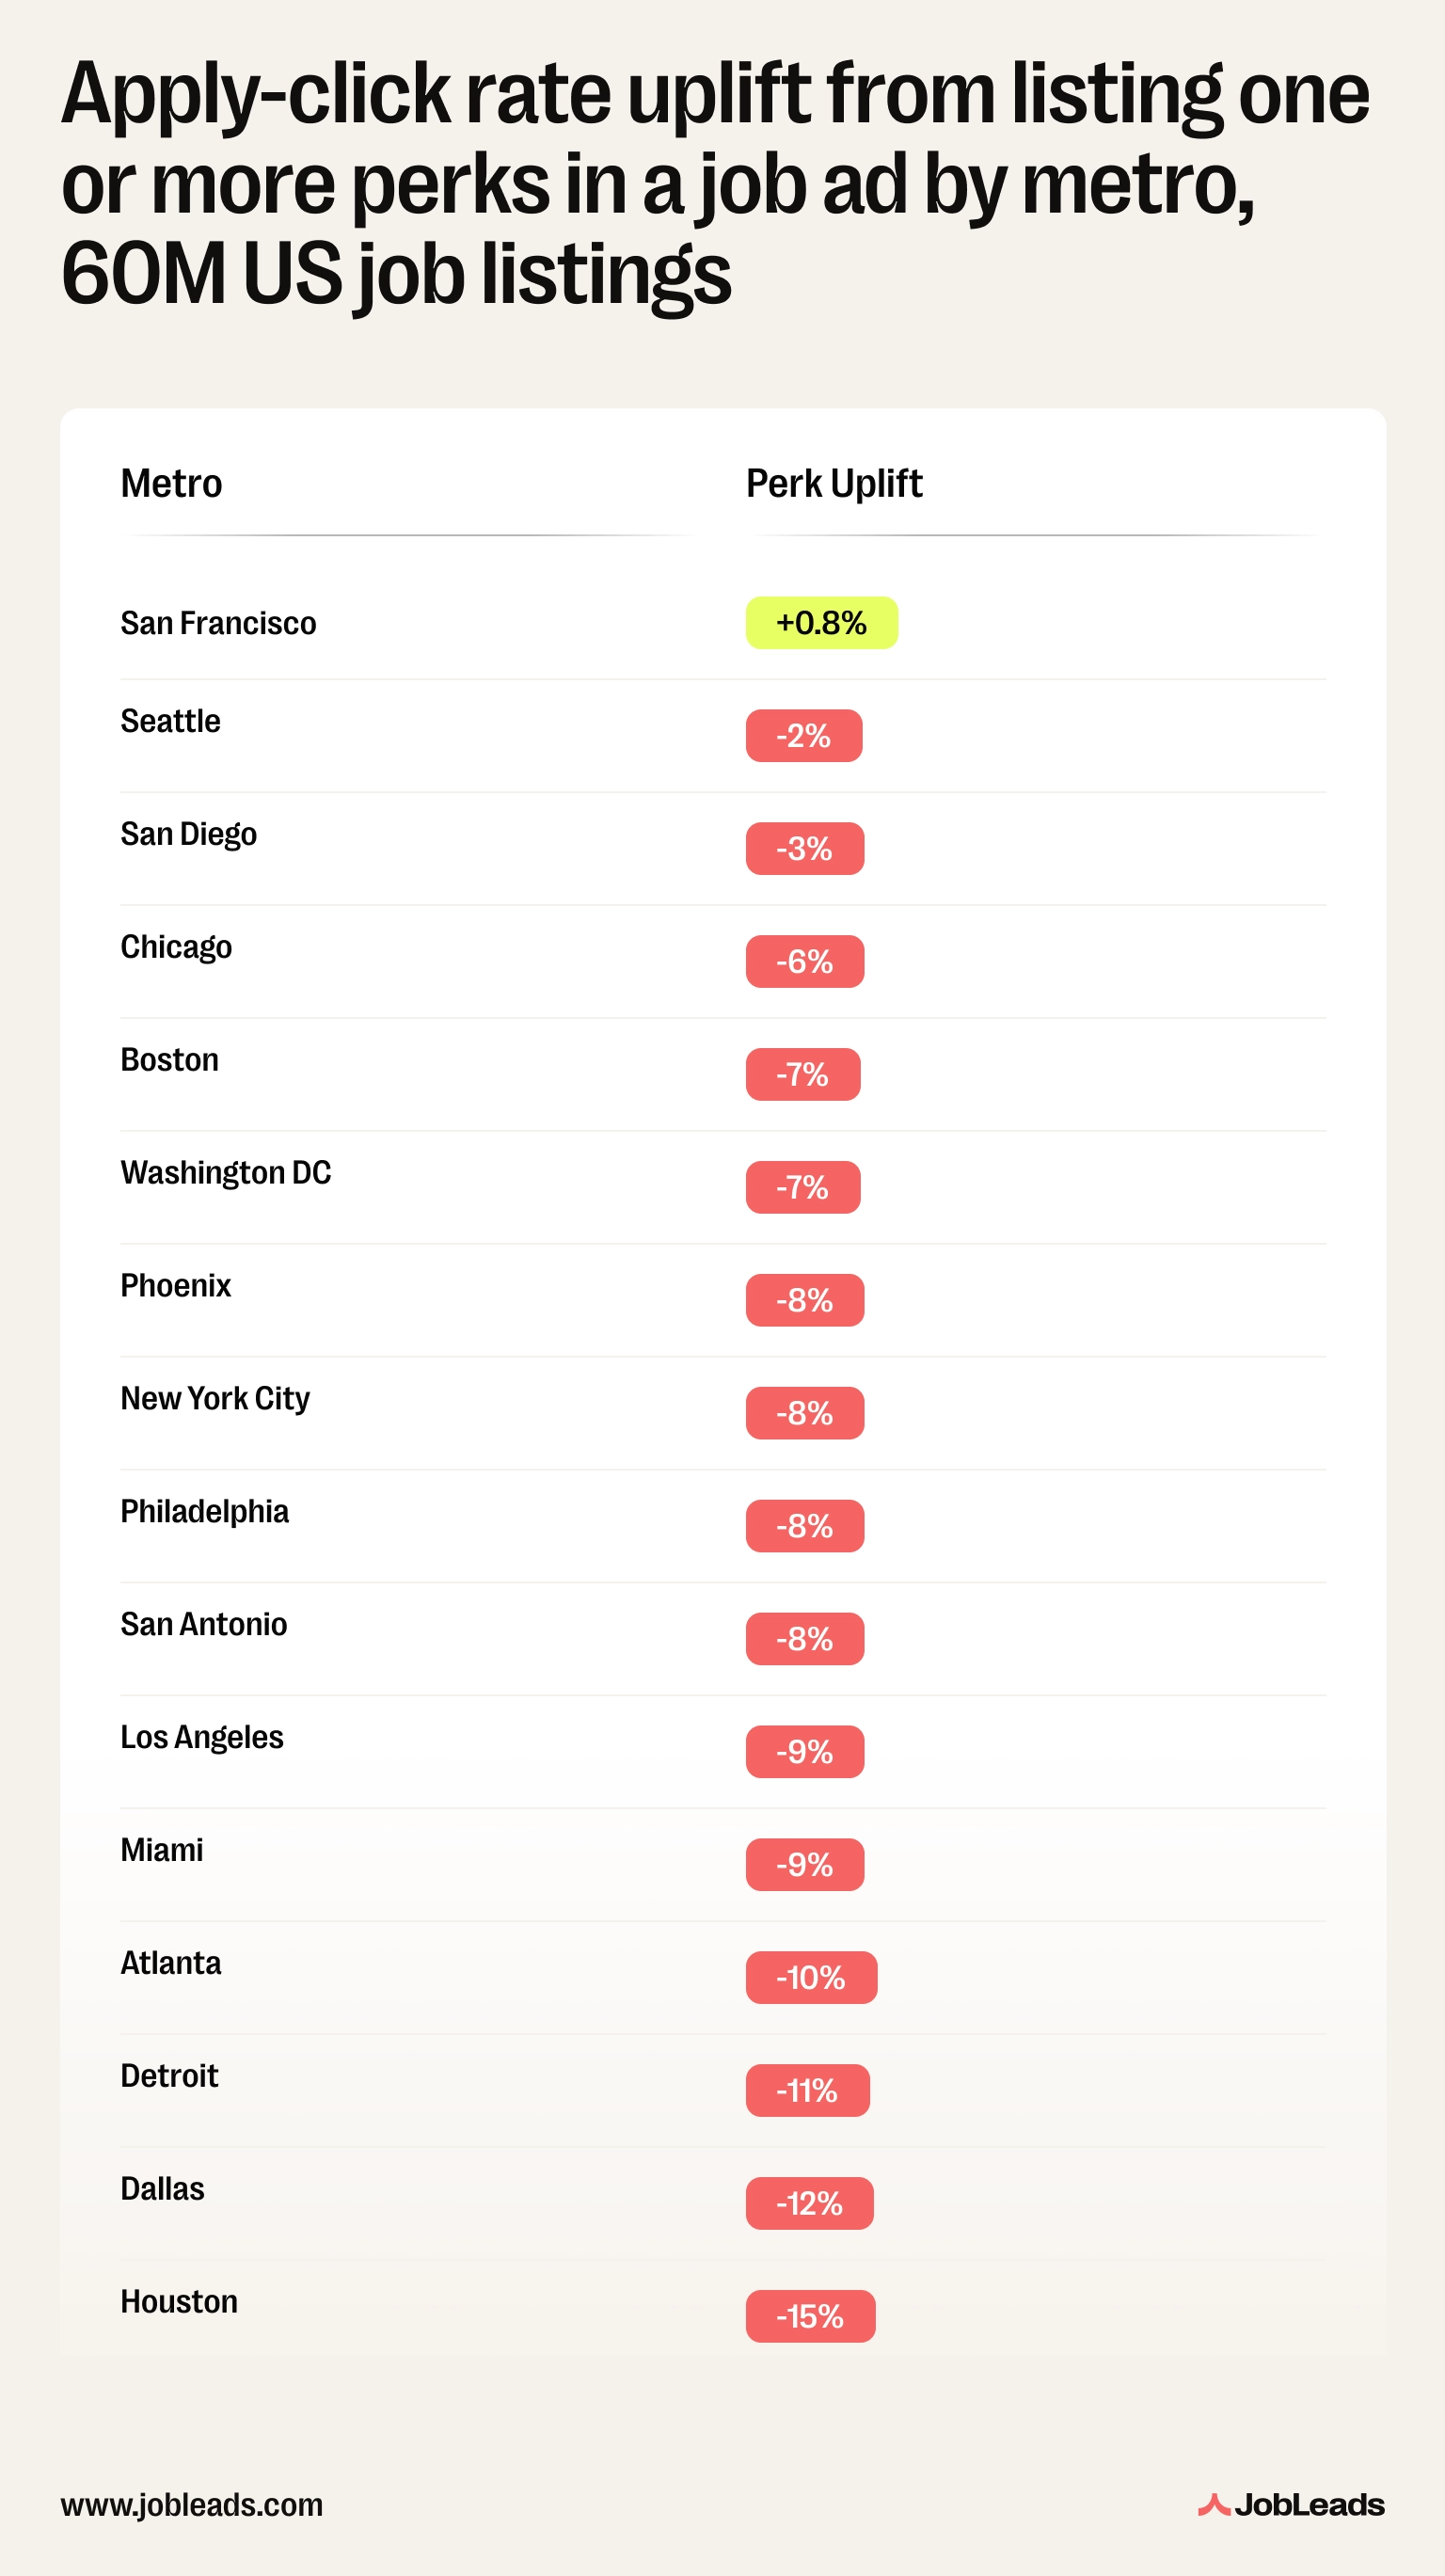
Houston is the place where listing perks doesn't work as well as in other major US metros. Houston job ads with no perks convert at a 52% apply-click rate. At the same time, Houston job ads with one or more perks convert only at 44%.
As many as 39% of Houston job listings include no perks at all, the highest zero-perk share of any major US metro, tied with Detroit. The Houston listings that do include perks tend to lean on common, low-impact ones rather than the perks that drive engagement nationally.
The mismatch sharpens at the perk level. The most-listed perk in Houston is pension/401(k), which is one of the two perks with effectively zero engagement uplift nationally, and a perk that's #1 in only one other metro in the country (Dallas).
The highest-uplift perk in Houston is employee discounts, which appears in only a small fraction of listings. Houston employers are concentrating their effort on the perk that does the least work, and underweighting the one that does the most.
SF job ads with no perks convert at a 64.7% apply-click rate. SF job ads with one or more perks convert at 65.2%, which makes it a +0.8% uplift–very modest but the only positive figure across all 16 major metros analyzed. Every other major US city, including New York, Boston, Los Angeles, and Chicago, shows a negative for listing perks.
Two structural factors likely explain why. First, SF's baseline apply-click rate is the highest of any metro in the country, in any cut of the data. SF candidates click and apply with more intent than candidates anywhere else.
Part of this is industry composition: SF is heavily tech-skewed, and tech listings tend to attract candidates who are already familiar with the format and know what they're looking for. Second, SF has the highest hybrid-job share of any major metro (18%), and hybrid listings convert at a higher rate than either fully remote or fully on-site listings nationally.
The combination of a tech-literate candidate pool and a hybrid-heavy job mix gives SF a head-start before perks even enter the picture.
Read more: Discover the highest paying cities in the world and where salaries go furthest.
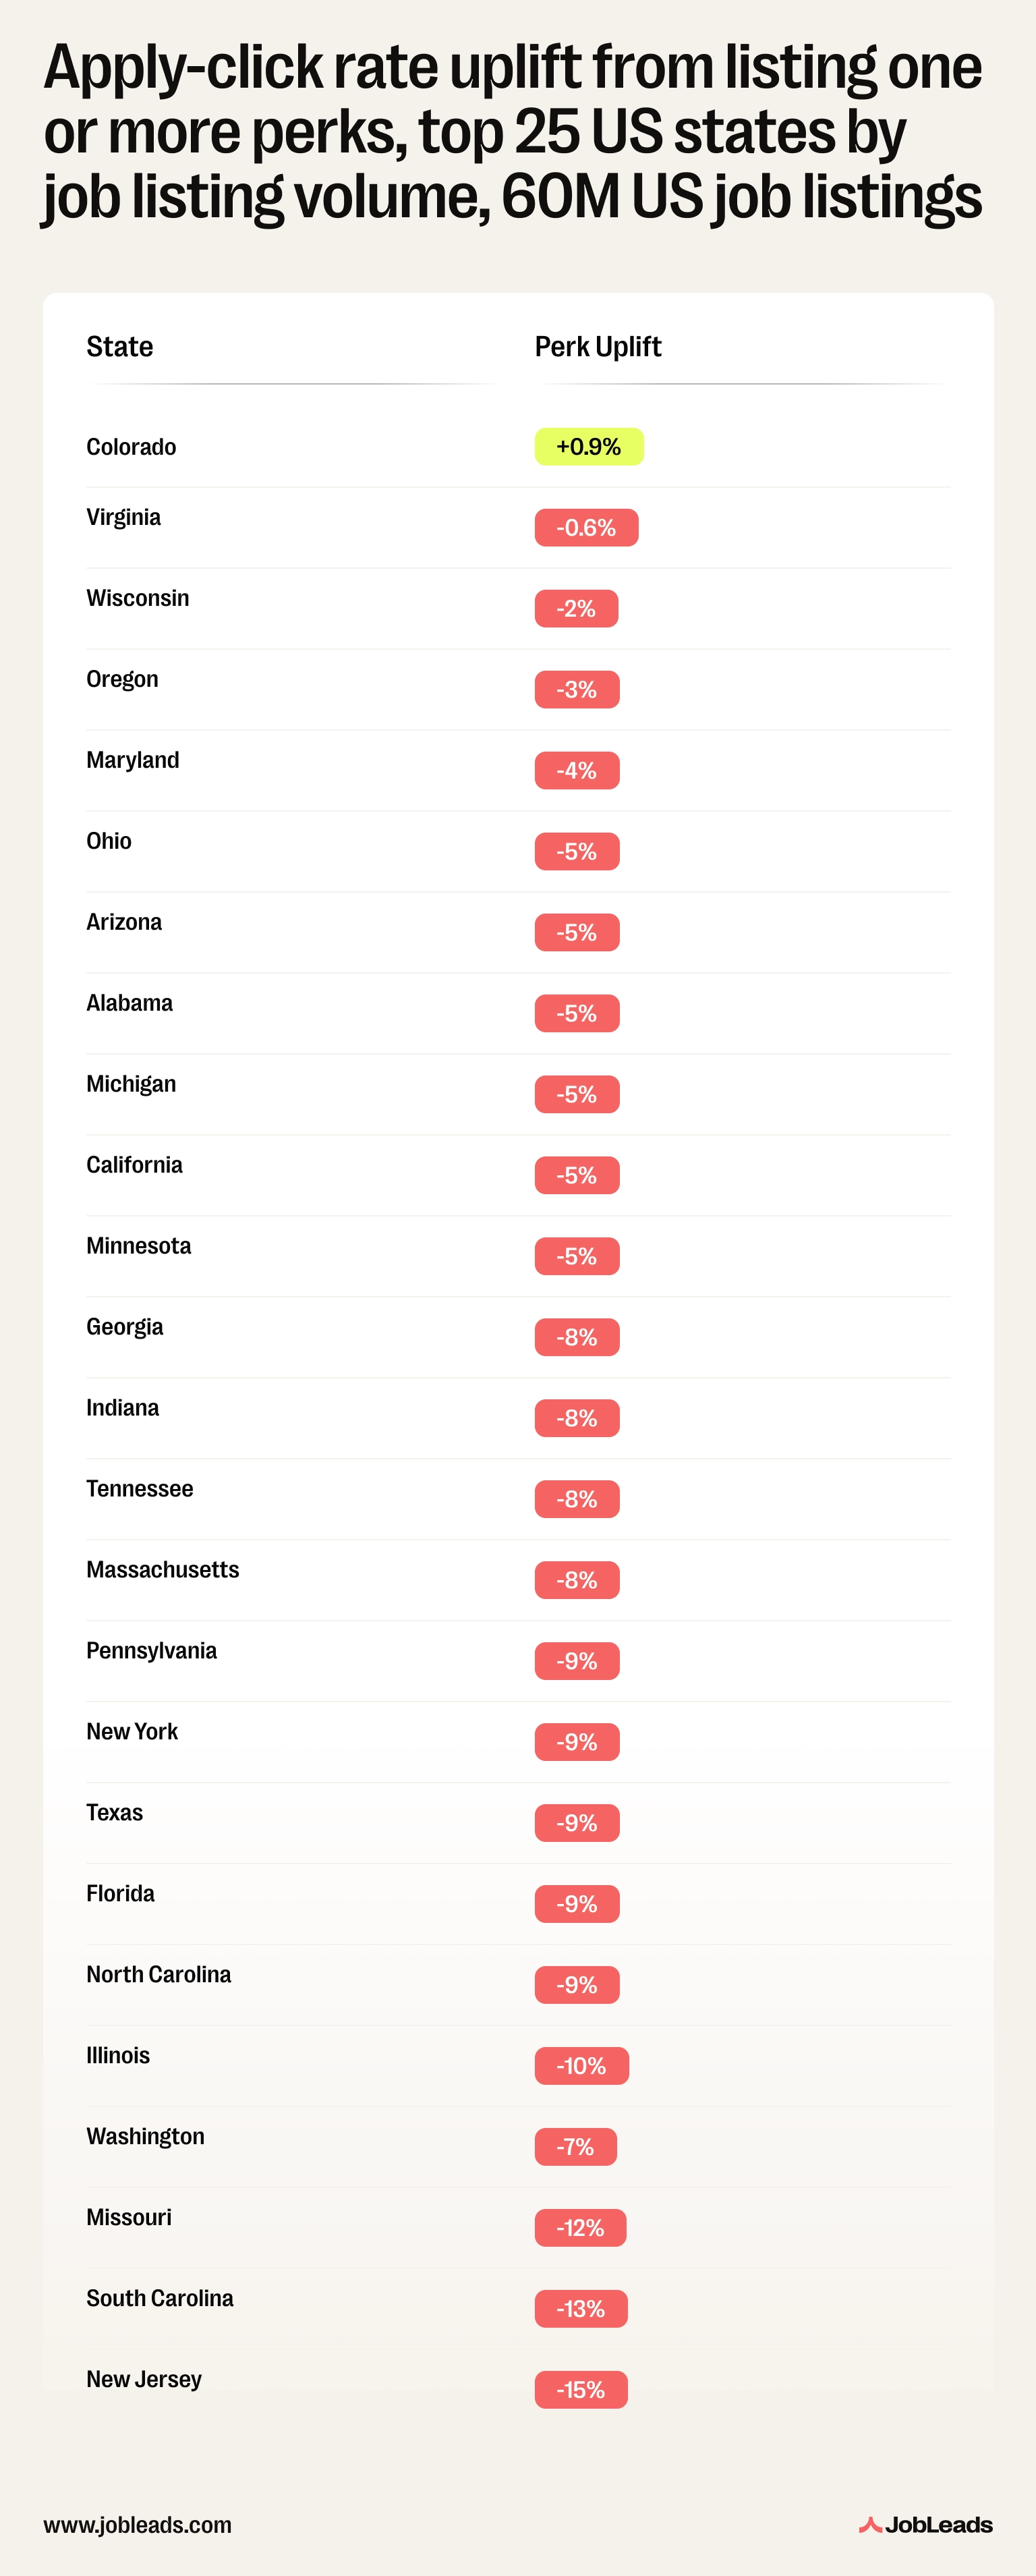
Across the 25 states with enough listing volume to analyse, Colorado is the lone state where listing perks produces a positive return. Colorado job ads with no perks convert at 47%; Colorado job ads with one or more perks convert at 48%–a +0.9% uplift. Every other state, from California to Texas to New York, shows a negative impact of listing perks.
What's distinctive about Colorado is the listings themselves. Colorado has the highest average perks per listing of any state in the dataset (4.1), well above the national average of 3.5. It also has the lowest zero-perk share of any state (20%), compared to a 31% national figure.
In other words, more Colorado employers list benefits, and they also list more of them. The state sits structurally on the right side of the U-curve identified earlier: most listings clear the 6+ perks threshold where engagement turns positive, rather than getting stuck in the 1-5 range where the penalty is steepest.
The thread running through 60M listings is that a benefits section is read as a signal, not just as a list of features. What perks reveal about the employer matters more than how many are listed. And the findings impact both employees and employers.
For job seekers: treat the benefits section as a tell. A listing with a couple of very generic perks usually signals a templated ad and an employer going through the motions. Six or more specific perks usually signals an employer competing for talent.
Mid-career candidates weighing two offers should give equity serious weight–it's the highest-impact perk for this group (+23%), and often the line item that decides which offer is better long-term.
Remote job seekers should look for flexibility repeated in the benefits section, not just in the headline–the gap between the two placements is the most reliable signal that a “remote” listing actually is remote.
For employers: list better perks, or none at all. A bare-minimum benefits section converts worse than no section at all. The threshold for benefits to help rather than hurt is six substantive perks–below that, the listing reads as templated.
Most US employers concentrate effort on the wrong perks: Health Insurance, Pension/401(k), and L&D Budget appear in 27-43% of listings and rank among the lowest-uplift perks tracked. Employee Discounts, listed by just 7% of employers, drives the highest engagement of any perk in the dataset.
Audience match matters as much as count. The perks that work for entry-level candidates aren't the ones HR teams typically pitch at junior hires. Senior candidates are largely perk-immune whereas remote candidates penalize office-coded benefits like company cars and reward explicit flexibility commitments. A benefits section copy-pasted across listings will, statistically, work for none of these groups.
JobLeads analyzed 60,825,242 US job listings first indexed between 1 January 2025 and 31 December 2025, using engagement data captured during the same period.
Step 1: Job listings
The dataset includes every US job listing live on JobLeads' platform during the 2025 calendar year. Each listing is tagged with metadata including job title, contract type, work arrangement (on-site, hybrid, remote), salary band, location (state and metro), industry, and the full text of the benefits section.
Step 2: Perk classification
The free-text benefits section of each listing was parsed and mapped to 14 standardized perk categories: Health Insurance, Pension/401(k), L&D/Training Budget, Extra PTO, Annual Bonus, Employee Discounts, Equity/Stock Options, Gym/Wellness, Parental Leave, Flexible Hours, Remote/Flexible Working, Company Car/Travel, Childcare, and Student Loan Repayment. A listing can match multiple categories; a listing with no recognized perk text is classified as “zero perks.”
Step 3: Engagement counting
For each listing, JobLeads counted distinct users (not events) who performed each action during 2025:
A single user clicking the same listing five times counts as one click. This deduplication is critical because it strips out repeat browsing behaviour and isolates real engagement.
Step 4: Apply-click rate
For any group of listings (for example, “all listings with one or more perks”), the apply-click rate is calculated as:
Total applies across the group ÷ Total clicks across the group
This answers the question: “for every unique visitor to a job page in this group, how often did that visit result in an application?”
Step 5: Uplift calculation
For each perk category, JobLeads compared the apply-click rate of listings with that perk to listings without it. The uplift figure is the percentage difference between the two:
Uplift = (Apply-click rate with perk − Apply-click rate without perk) ÷ Apply-click rate without perk
A +18% uplift means listings with that perk convert 18% better than listings without it. A –5% uplift means listings with that perk convert 5% worse.
Step 6: Salary, seniority, and geographic cuts
Salary quartiles were calculated after capping salaries at the 95th percentile to remove outliers. Seniority (entry-level, mid-level, senior) was classified from normalized English job titles. State and metro analysis was limited to the top 25 states and top 16 metros by listing volume to ensure adequate sample sizes.
Limitations
This is correlation, not causation. The data shows which listings convert better, not why. A listing with Employee Discounts may convert better because of the perk itself, or because employers who offer Employee Discounts also write better listings overall, or because they cluster in industries with higher baseline engagement. The findings should be read as patterns, not prescriptions.
Negative uplift can reflect different things. When a perk shows a negative uplift, it may mean the perk genuinely deters applications, or it may mean the listing attracted more casual browsers who clicked but didn't apply. The metric measures the ratio, not the underlying intent–both interpretations are consistent with the data.
Some categories have small samples. Childcare appears in just 0.6% of listings and Student Loan Repayment in 1.1%. The uplift figures for these perks are real but more sensitive to listing-mix effects than higher-prevalence perks.
Geographic findings may partly reflect industry composition. San Francisco's positive perk return, for example, is partly attributable to a heavily tech-skewed listing pool. The Houston penalty is partly attributable to a lower proportion of tech and professional services listings. Where structural composition matters, we've flagged it in the analysis.
Perk classification depends on listing text. A perk that's offered but not listed in the benefits section won't be captured. Conversely, vague language (“competitive benefits”) is not classified as a perk, even when concrete benefits exist behind the scenes. Likewise, the final take-home benefits are not known. The dataset measures what's written, not what's offered.
The findings, statistics, and visuals in this study may be shared and republished for non-commercial purposes. If you reference this research, please credit JobLeads with a link back to this page so your readers can access the full methodology and dataset.
For media enquiries, custom data cuts, or interview requests, please contact press@jobleads.com.

Digital PR & Content Marketing Manager at JobLeads
Maryia leads digital PR and outreach at JobLeads. Her work has earned coverage in Fast Company, AOL, Forbes, Fortune, Quartz, and ZDnet—and she specialises in building the systems that make that happen at scale.
Job Market TrendsJobLeads study on 811K job postings and 245K professionals reveals the differences in workers' salary expectations and wages offered by employers.
 Career Development
Based on 7,700+ survey responses, here are the biggest benefits of remote work for employees and employers, and what people would give up to keep working remotely.
 Job Market Trends
Understand the state of remote work in the US in 2026 with JobLeads data on hiring demand, industry trends, regional patterns, and worker preferences.