
 Job Market Trends
January 19, 2026
US Remote Work Statistics and Trends [2026 Study]
Understand the state of remote work in the US in 2026 with JobLeads data on hiring demand, industry trends, regional patterns, and worker preferences.


You've probably heard that January is the best time to look for a job. New year, new budgets, hiring managers ready to fill the roles that stalled in Q4.
Sensible advice–but not entirely correct.
Waiting until January, then taking your time before hitting submit, turns out to be a far more costly mistake than applying in the wrong month.
A JobLeads study of over 55 million US job listings and 143 million user interactions found that the most important variable isn't which month you apply. It's how fast you apply after a job goes live.
Let’s go through each of the findings one-by-one.
Most job seekers don't apply the moment they see a listing. They read it twice, check the company on LinkedIn, look up the salary range, revisit their CV, sleep on it. That instinct to be thorough is understandable. But the data suggests it costs applicants more than they realise.
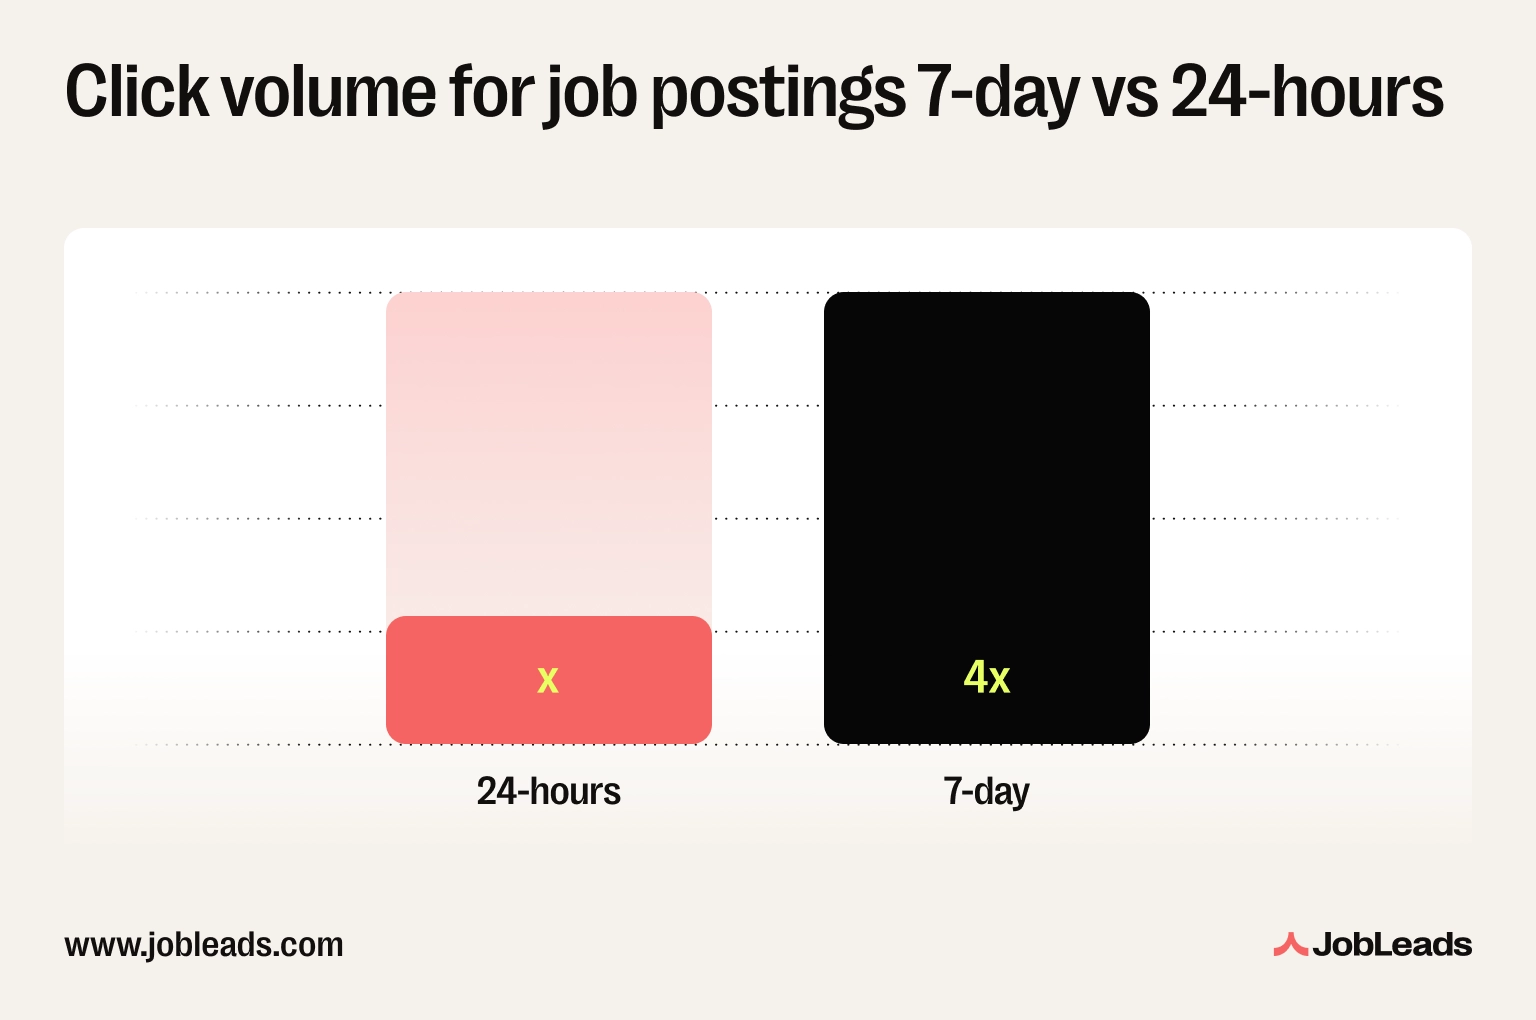
On average, 7-day click volume on a job listing is nearly 4 times higher than 24-hour click volume. That means roughly 74% of first-week applicants arrive after day one. Applying the day a job goes live means you're only competing with around 20-35% of the first-week pool, depending on the month.
The per-job competition in the first 24 hours is also remarkably consistent across the year. And most job listings receive almost no clicks on day one at all. The opportunity isn't just real, it's largely unclaimed.
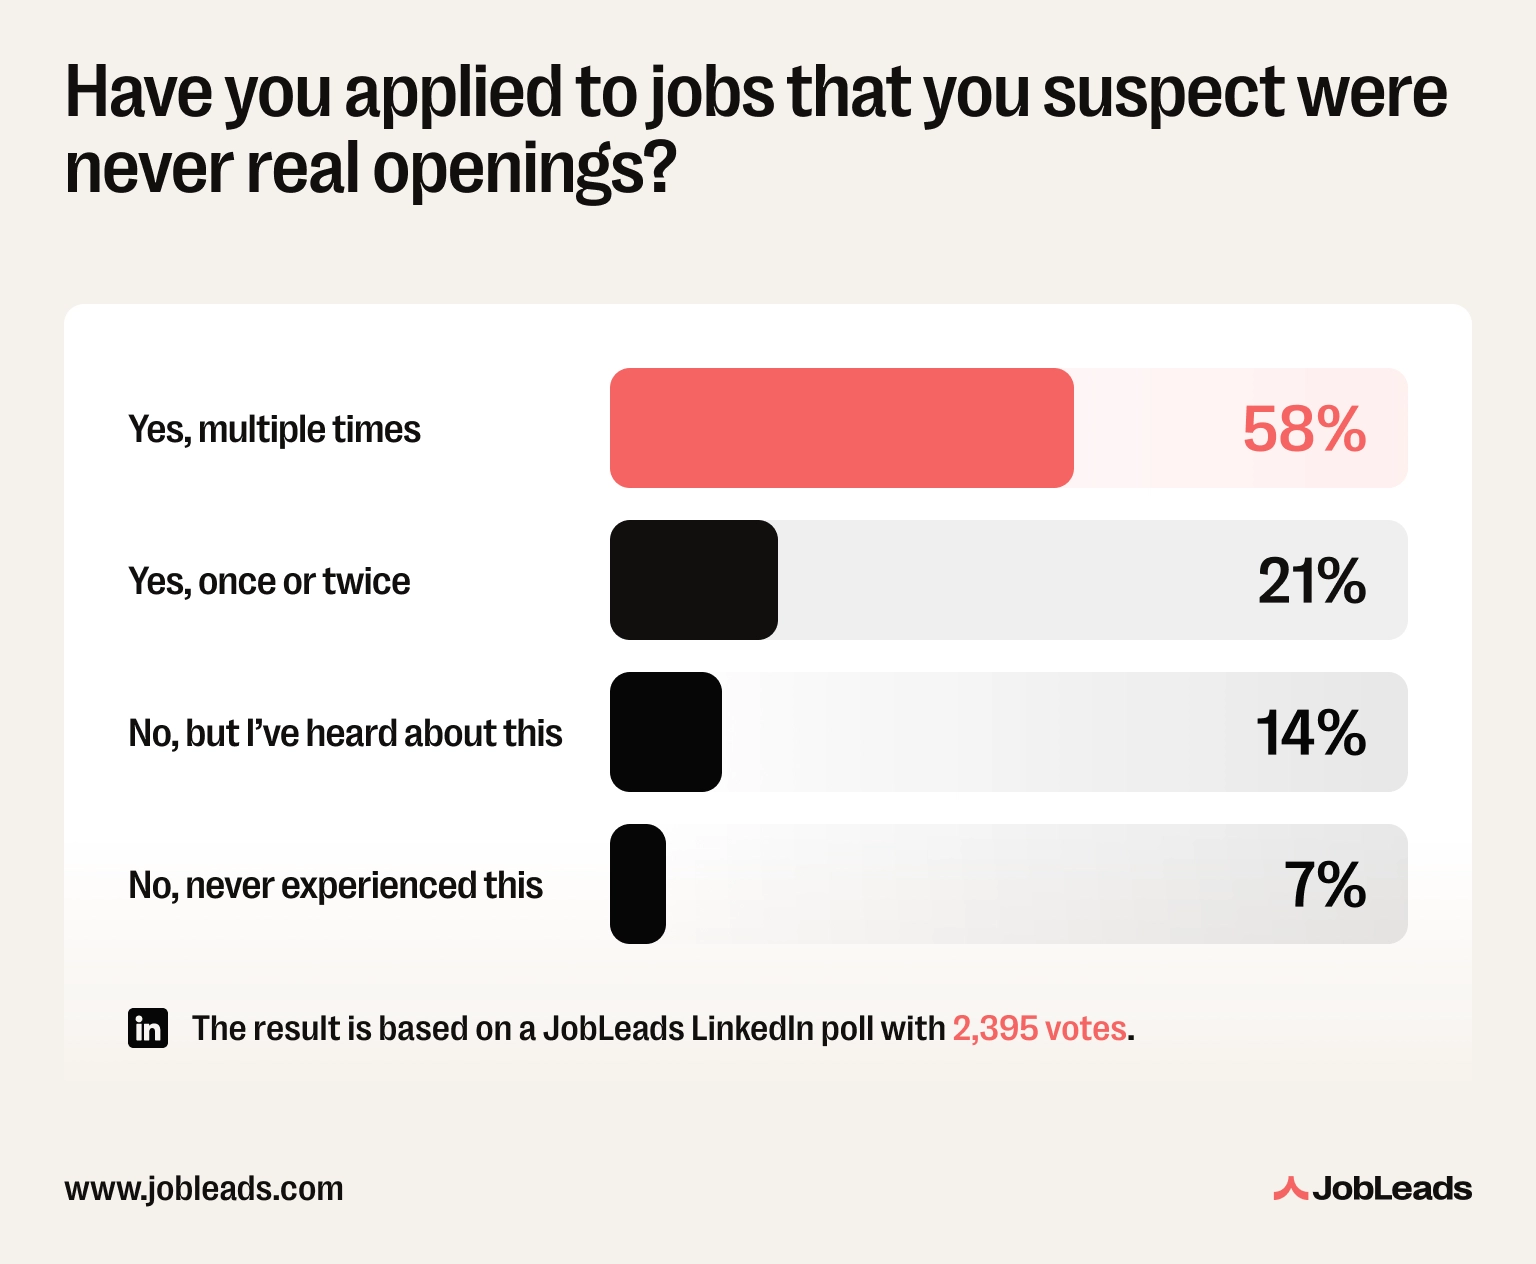
This could be because many job seekers browse casually a few times a week rather than checking daily. Others wait for the listing to appear on multiple platforms before they trust it's genuine. In fact, a JobLeads survey found that 89% of people have previously suspected that a job application wasn’t a real opening.
Also, applying quickly feels risky to many people. It can seem impulsive, or signal desperation. But from a recruiter's perspective, a fast application often signals exactly the opposite. It shows a genuine interest and readiness.
This is consistent with findings from Huntr's report, which discovered that candidates typically wait about 5-6 days to receive their first interview call after applying. The first batch of applications reviewed by a recruiter tends to receive the most attention, and the shortest response time. That batch belongs to the people who applied on day one.
The advantage also varies slightly by month. June offers the strongest day-one edge. Here, the 7-day-to-24-hour ratio reaches nearly 6x, meaning same-day applicants face proportionally less competition than in any other month. This is likely because June sits in the run-up to the summer slowdown and job seekers aren't yet fully back in search mode, so early movers benefit from a quieter field.
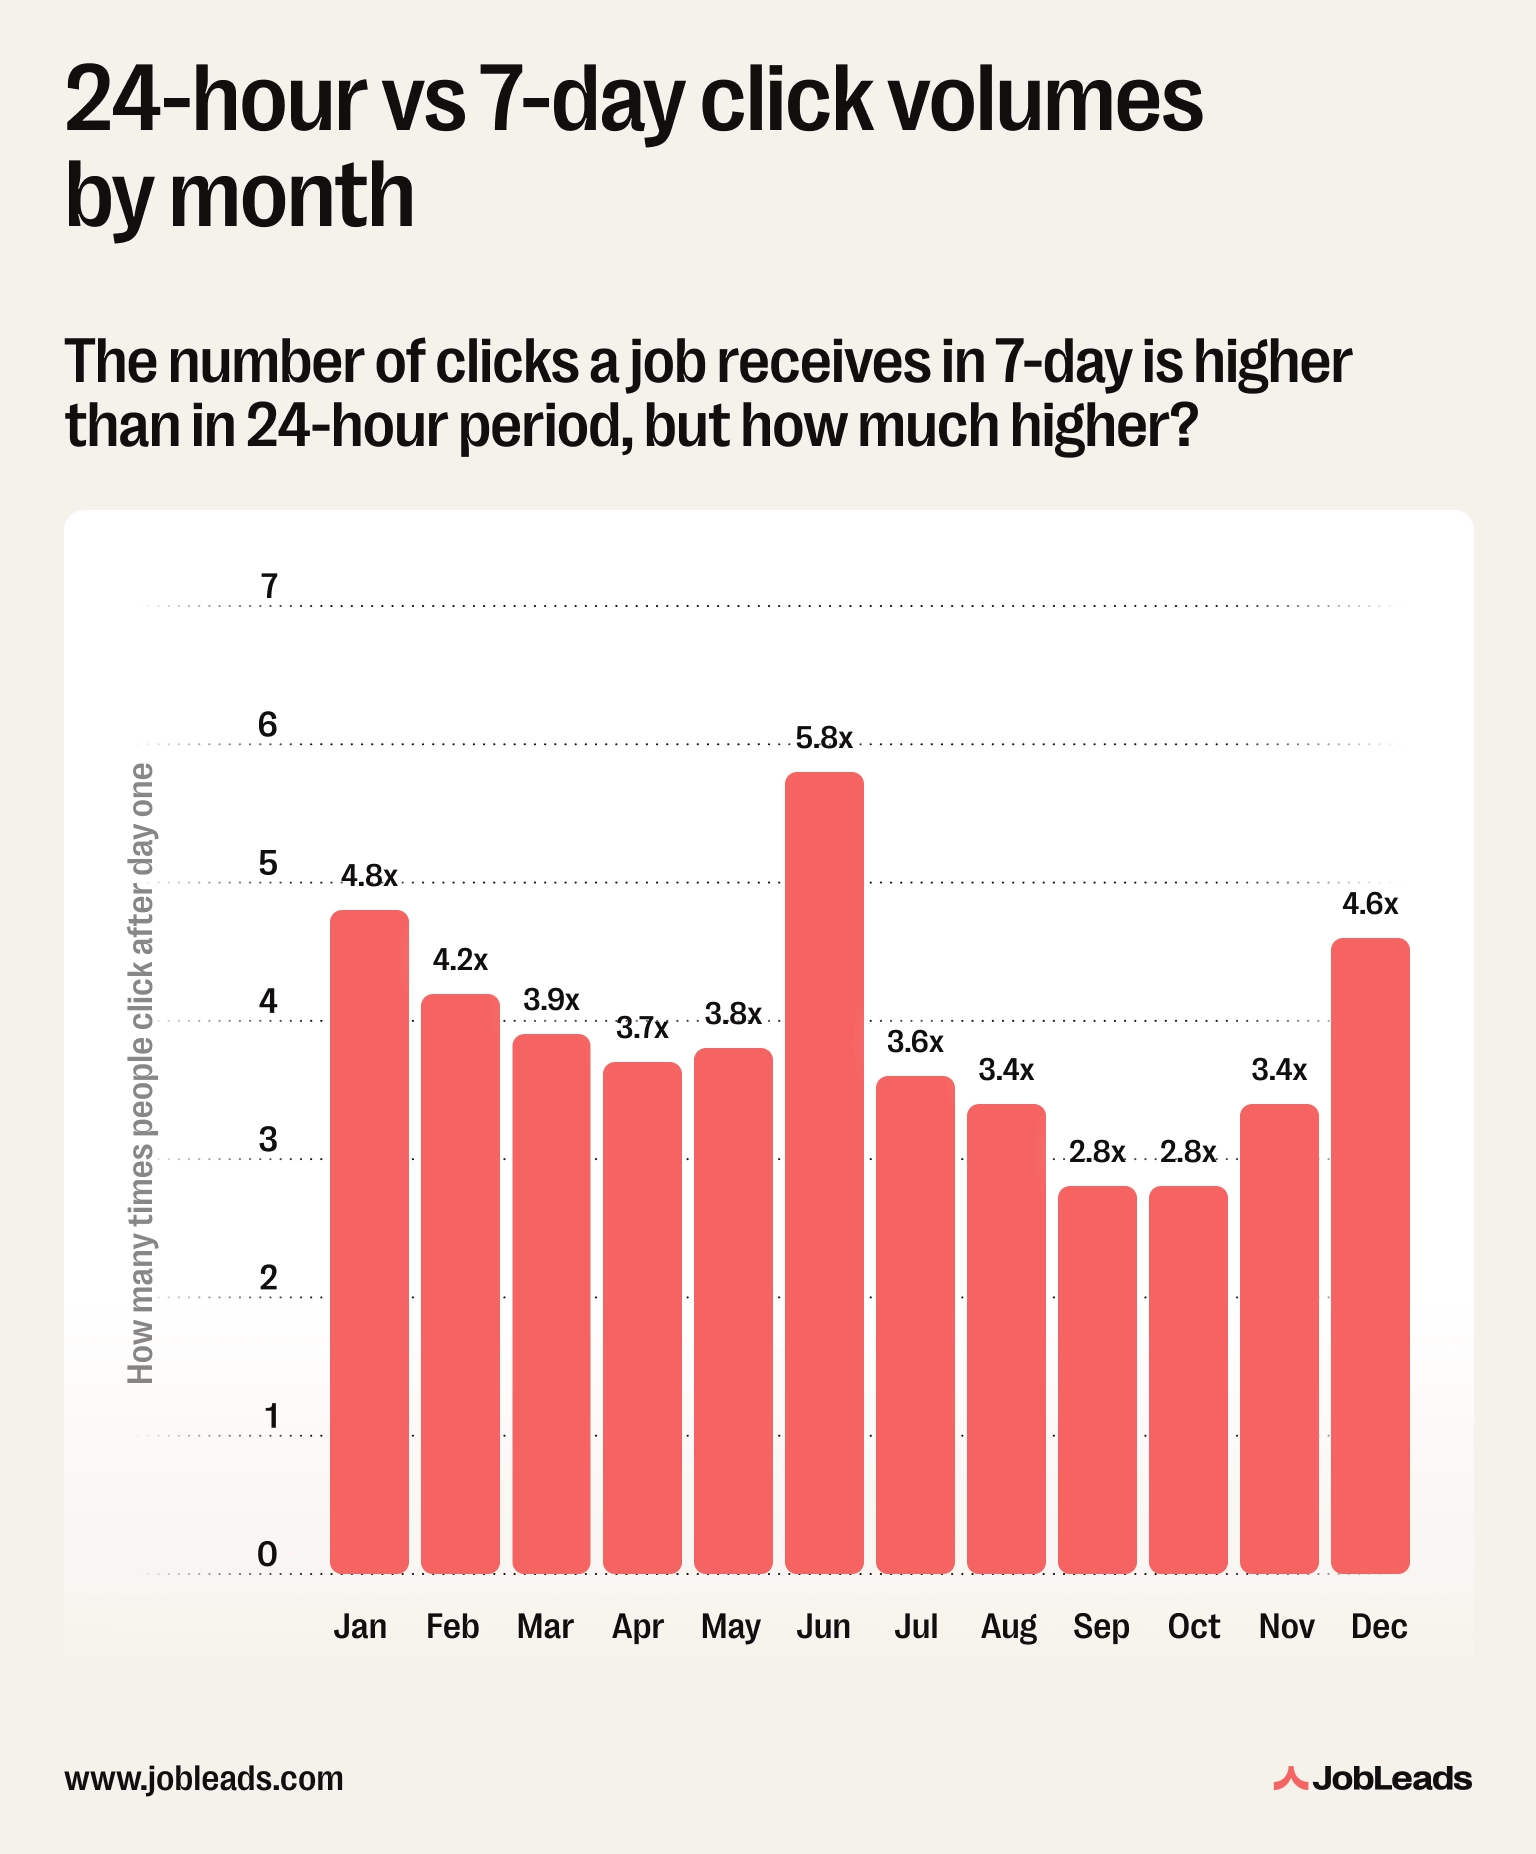
At the other end, September and October have a ratio of just 3x, which is the smallest gap between day-one and full-week competition. Autumn listings tend to attract faster initial engagement, possibly because job seekers returning from summer are more focused and responsive. Also, companies posting in September often tend to have genuine urgency to fill roles before year-end.
Bottom line–regardless of when you search, submitting your application within 24 hours of a listing going live is the single biggest lever you have over other candidates.
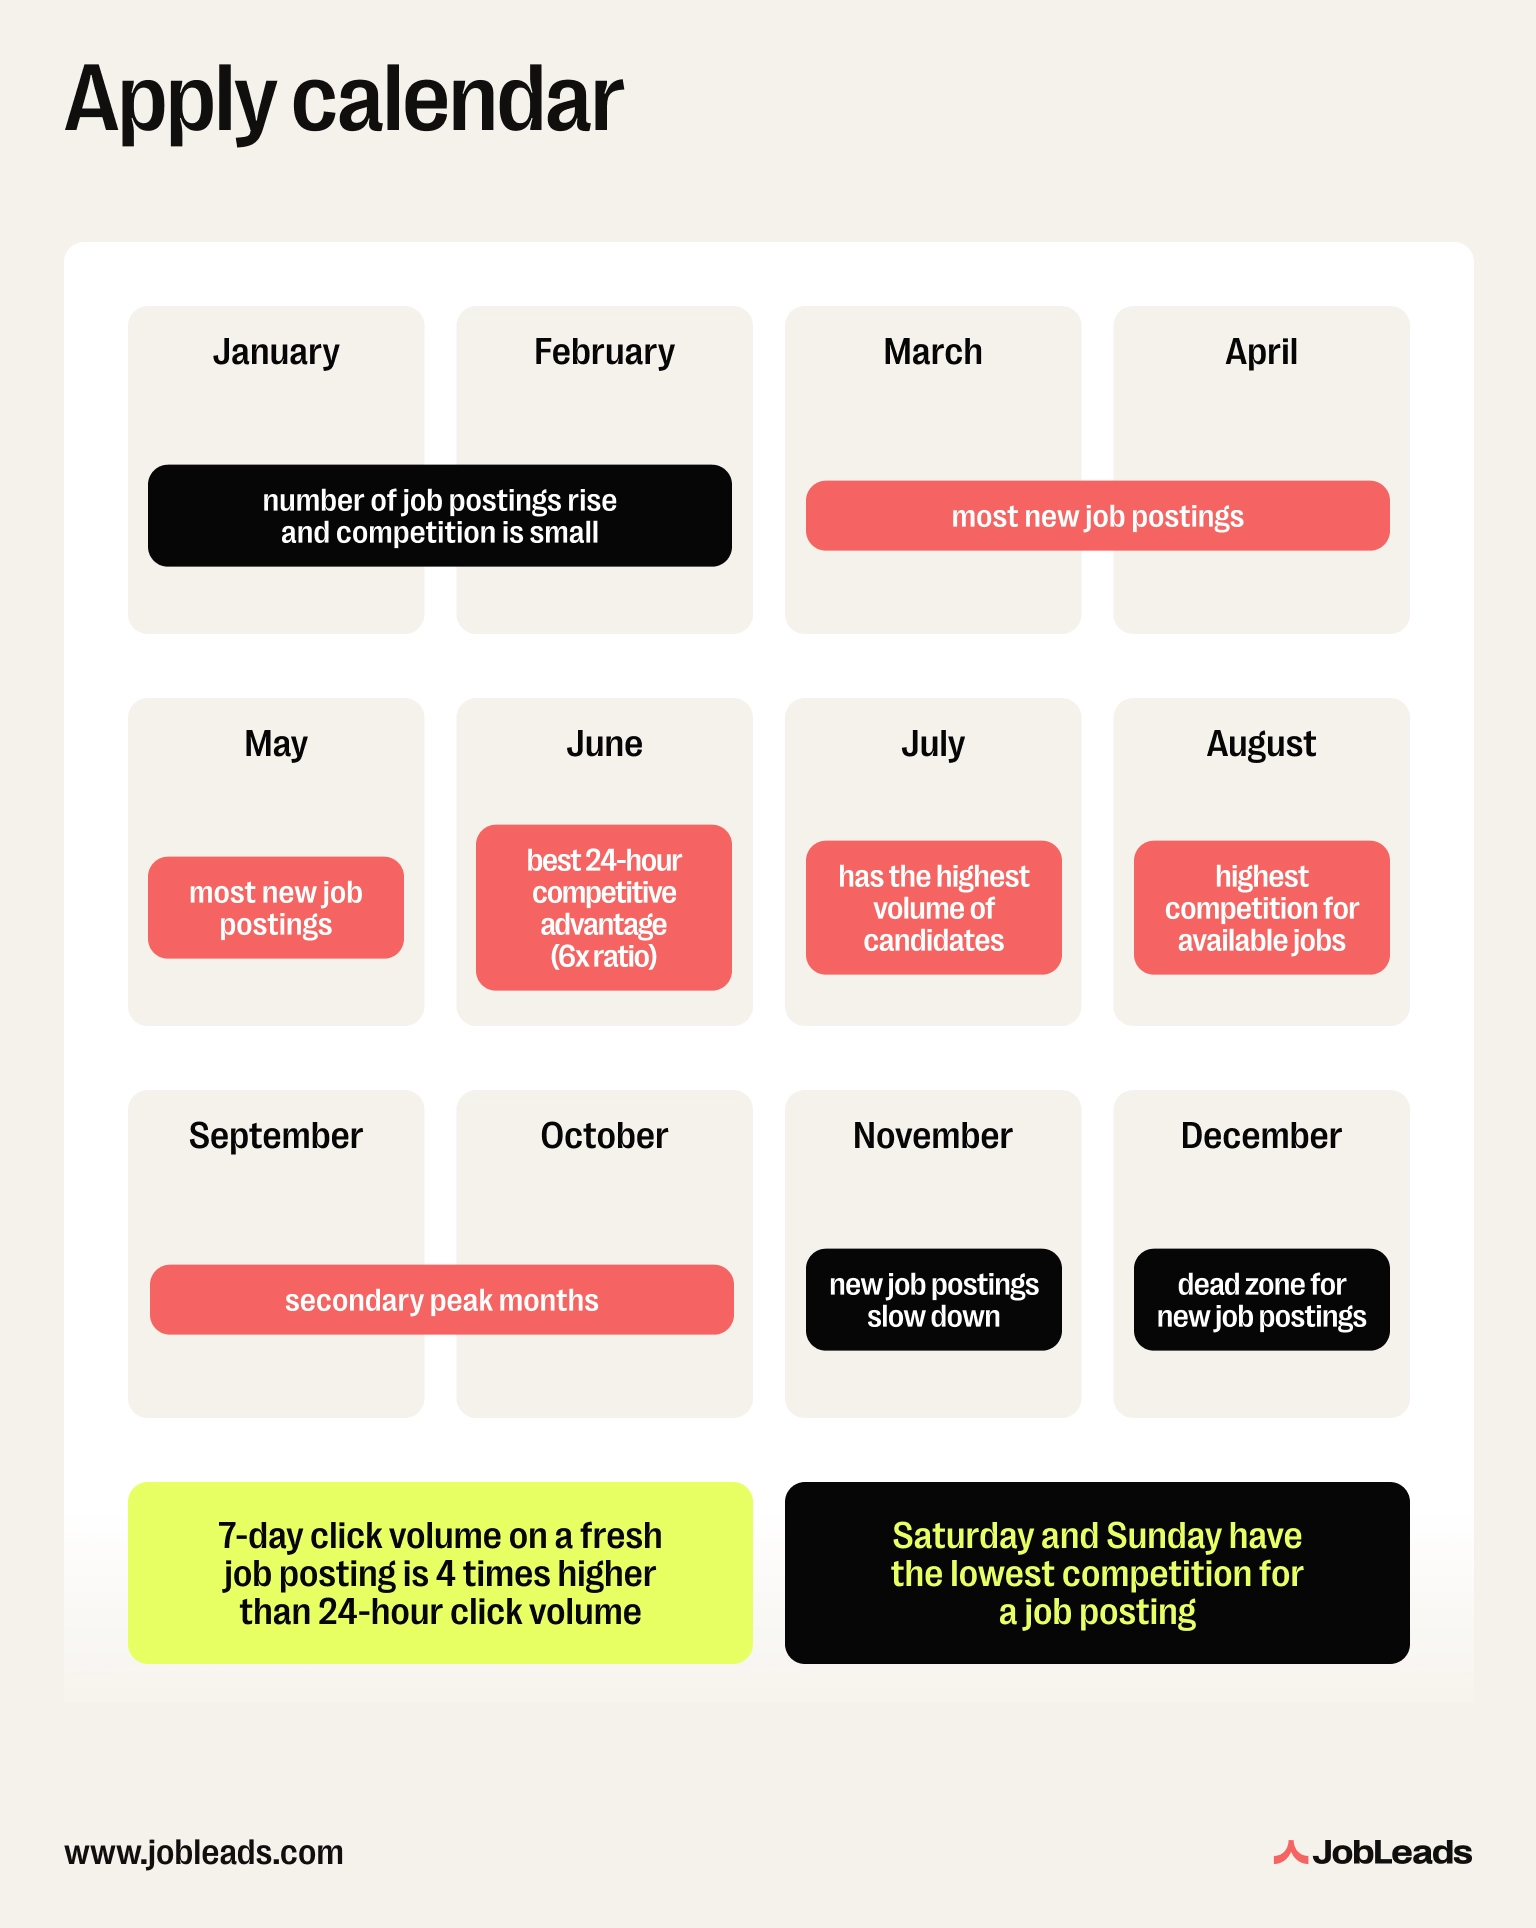
If you want to understand when hiring season in the US is, the answer is broader than you’d expect. The seasonal hiring index shows elevated activity from May through November, with a brief pause in August. Here’s a month-by-month hiring calendar:
| Month | Listing volume | What it means for applicants |
|---|---|---|
| January | Rising (+49% vs Dec) | The bounce is real, but engagement hasn't peaked yet, which is a good early window |
| February | Steady growth | Competition still catching up, this is an underrated month for early movers |
| March | Strong increase | Best ratio of new listings to active competition |
| April | Near-peak | Spring wave building, which is still favourable but field is filling up |
| May | Peak (8.6% of annual) | Most listings available, but also peak competition, job seekers shouldn’t delay |
| June | Still strong | Best 24-hour competitive advantage of any month (6x ratio) |
| July | Moderate listings | Engagement peak, has the highest competition per job |
| August | Summer dip (6.5%) | Fewest new listings of any full month, hiring decisions stall |
| Sep-Oct | Secondary peak | Strong rebound, roles fill faster because of autumn urgency |
| November | Declining | Q4 slowdown begins, year-end hiring is mostly done internally |
| December | Lowest activity | Quiet on both sides, applicants should use this period to prepare, not search actively |
May through July is the peak hiring band. The seasonal index, which strips out platform growth, shows these three months clustered at index 62-66, roughly 6 times the January-February level. No single month dominates and the peak seems to be a plateau.
March and April build steadily toward that peak, as companies move from post-Q1 budget approvals into active recruitment.
But, the peak posting month is not the same as the best time to apply. Here's the problem with waiting for May: everyone else is waiting too. And more job seekers are active precisely when more jobs are available, which dilutes the advantage of a larger market.
This pattern is broadly confirmed by the US Bureau of Labor Statistics' Job Openings and Labor Turnover Survey (JOLTS), which tracks monthly job openings across the economy. JOLTS data shows openings peaking in the January-May window, with a secondary rise in September, before declining into year-end. This is consistent with the employer posting behaviour captured in JobLeads' own dataset.
The spring hiring surge is mainly caused by the corporate budget cycles. Most companies set annual headcount plans in Q4 of the prior year and get final approval in January or February. By March, those approvals have filtered down to hiring managers who can now post roles.
Most HR departments (…) do their budgets at the end of the [previous] year for the brand new year, and the budgets include salary, which means they can prepare to hire certain positions.
Karen Burke – HR Knowledge Advisor at the Society for Human Resource Management (SHRM)
There's also a cultural dimension. Spring is when the workforce itself is more mobile. People who've been waiting for their annual bonus (typically paid in Q1) are now free to leave. University students are graduating and entering the market. Performance reviews have been completed, and those who didn't get the promotion or raise they hoped for start looking.
The January bounce is real. In fact, January 2025 saw 49% more job listings than December 2024.
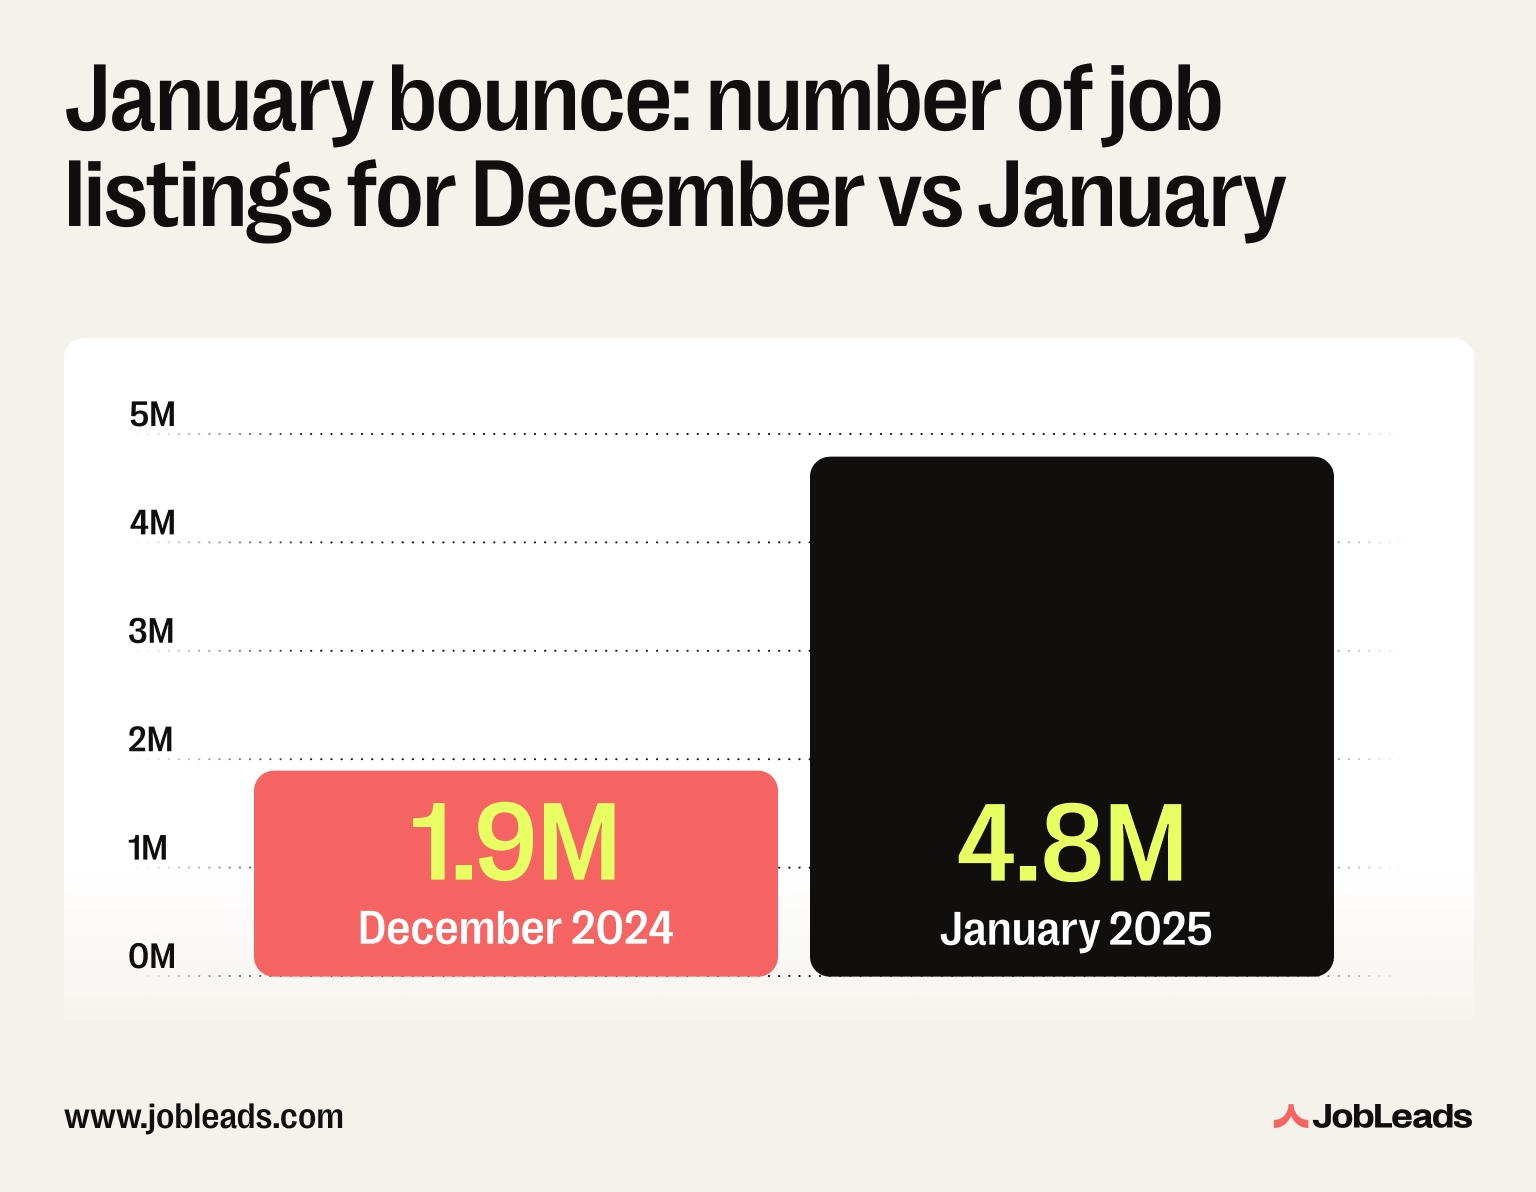
So, the conventional wisdom isn't entirely wrong. But the reason January feels like hiring hot season is partly perception–after a quiet December, any uptick in activity feels dramatic.
There's also a recruiter behaviour pattern worth noting. And it’s that many hiring managers return from the holiday break with a list of roles they want to fill but haven't yet written the job descriptions for. Job postings lag behind the intention to hire by two to four weeks. The January listings you see were decided in December. And the real surge of fresh mandates arrives in February and March.
Indeed's career advice team echoes this pattern, noting that while January and February tend to see high posting volume, spring is equally productive. That’s because companies extend their Q1 hiring push well into May, particularly for senior and specialist roles.
August is when job seeker engagement peaks but new listings dip–the seasonal index drops to 27, its second-lowest point after January-February. The result is the most competitive period on a per-job basis.
Why does this happen? Well, several forces converge.
Parents of school-age children return to the job market in September, but for the childless workforce, summer is often the most flexible time to explore new roles. That’s because holidays are booked, work feels slower, and there's mental space to consider a change. Meanwhile, in July and August, many hiring managers are on holiday themselves, meaning fewer new roles are being approved and posted.
Bottom line–Q1 (January-March) is the preparation window. Listing volume is at its seasonal lowest (index 9-25), but engagement hasn’t peaked either. Job seekers who start preparing here position themselves to move fast when the May-November hiring plateau begins.
Strategic move: Job seekers should start searching in March to ride the spring hiring wave before it peaks. If they miss spring, September-October is the next best window. Moreover, applicants should use August and December to prepare applications and be able to move fast when volume returns.
Most people treat job searching as a weekday task. And the data confirms this: Monday and Tuesday together account for around 36% of all weekly application activity. Both days are significantly busier than any other point in the week.
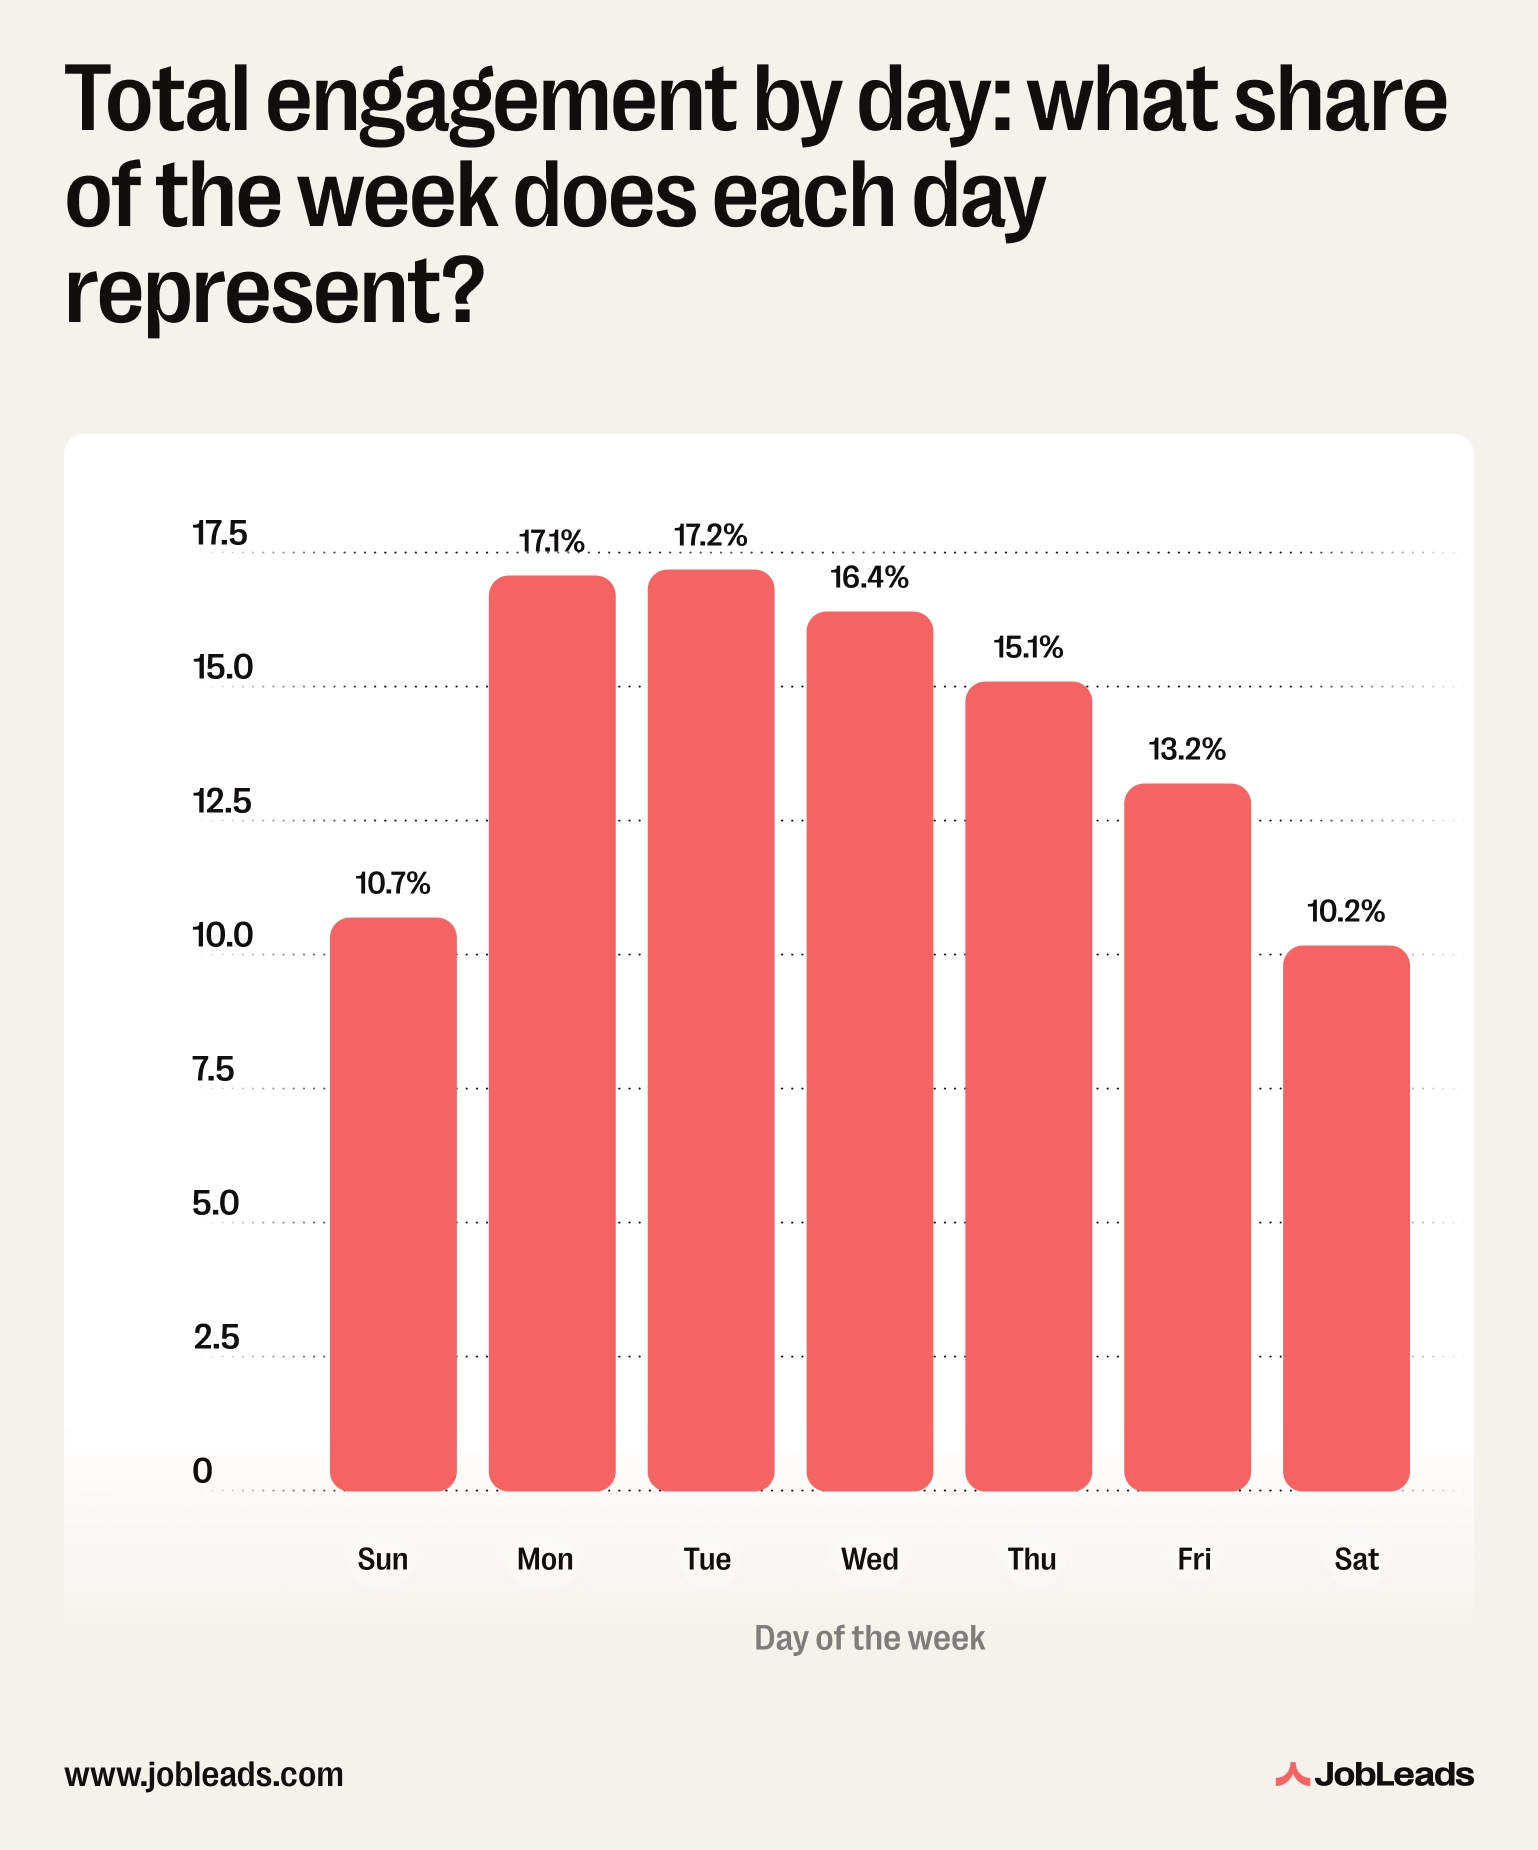
Saturday is the quietest day by a substantial margin with about 39% less activity than the peak days. Sunday sits slightly above Saturday, reflecting what might be called the “Sunday Scaries” effect. This happens when job seekers who've spent Saturday relaxing start to feel the pull of the working week on Sunday evening, and begin browsing listings before the week begins.
Importantly, the pattern is identical for both clicks and applications as there's no day where people browse more but apply less. If someone engages with a listing, they tend to apply in the same session. This means that applying on a quieter day reduces browsing competition and the actual applicant volume.
This phenomenon is likely due to most employed job seekers doing their searching during the working week: not out of desperation but because that's when they're thinking about work. Monday brings a fresh inbox and renewed motivation to make a change. Tuesday is when that motivation converts into action.
There's also a supply-side nudge. Many recruiters and hiring teams post new roles on Monday morning, which means job boards surface them prominently on Monday and Tuesday when their algorithms weight recency. More visible listings generate more applications, reinforcing the pattern.
This is consistent with research by ZipRecruiter, which has found that Tuesday is the most popular day for both employers to post jobs and for candidates to apply. This makes Tuesday the most competitive day in the cycle. Applying during the weekend positions your application to be reviewed before that Tuesday wave arrives.
The 24-hour rule applies to every job search. But it's especially critical if you're targeting 6-figure salary roles. That’s because the higher the salary, the more crowded day one becomes, and the fewer listings there are to absorb that competition.
| Salary range | Clicks per 1K jobs |
|---|---|
| $20k+ | 5.3 |
| $40k+ | 25.0 |
| $60k+ | 35.0 |
| $80k+ | 47.5 |
| $100k+ | 66.6 |
| $125k+ | 69.7 |
| $150k+ | 63.7 |
| $200k+ | 52.5 |
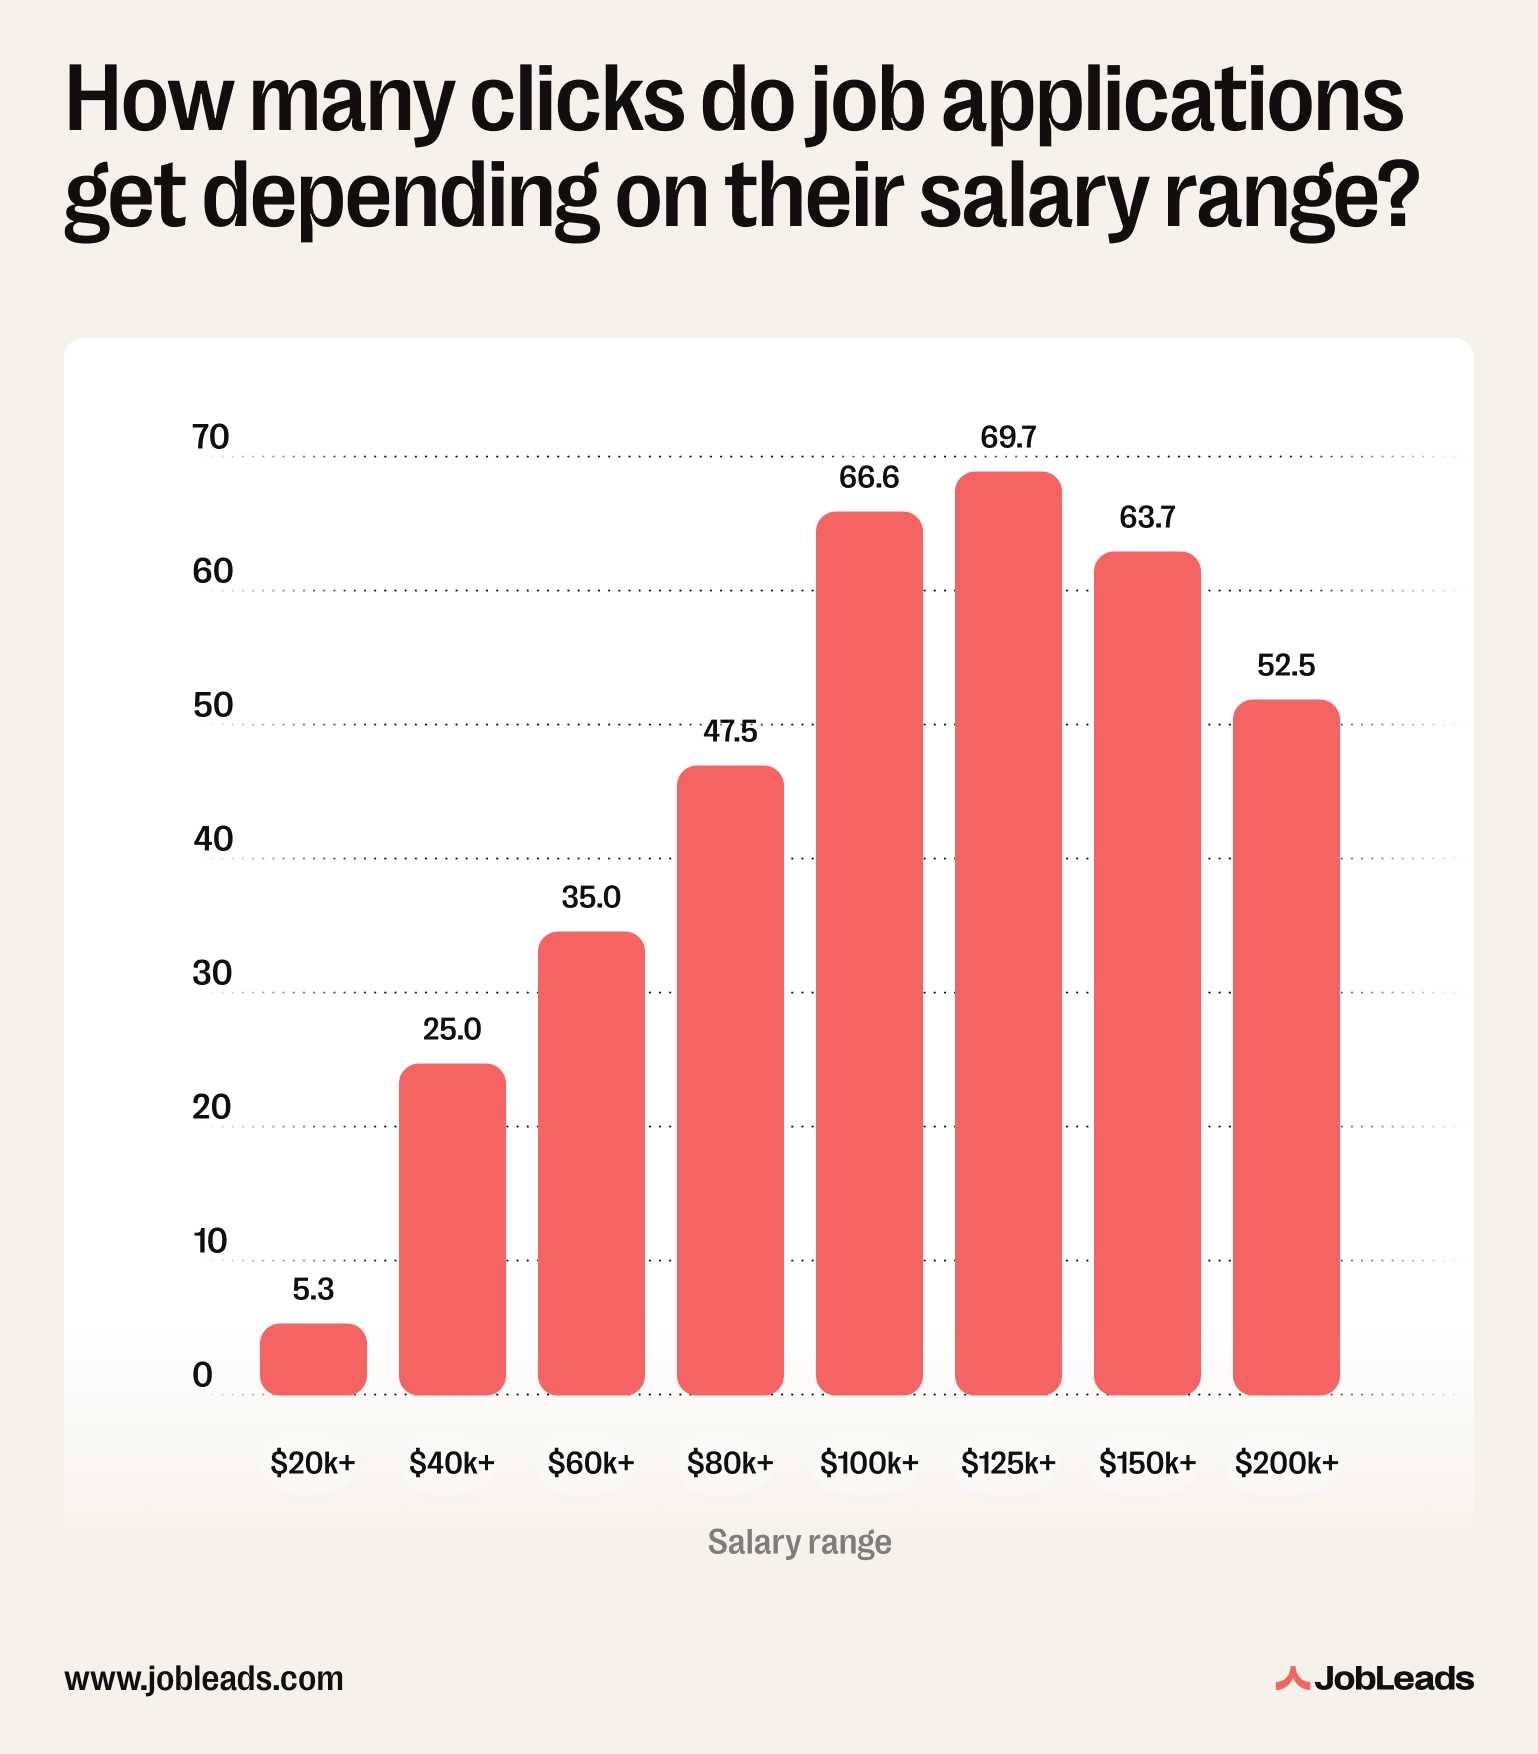
Click intensity, first-day clicks per 1,000 jobs, scales sharply with salary. Roles that offer over $125K attract nearly 13x more clicks than $20K+ roles.
One interesting nuance is that click intensity dips slightly at the $150K+ and $200K+ tiers. This likely reflects the increasing role of executive search firms at the very top of the market. Roles above $200K are often filled privately, through networks and retained search, rather than through public listings. What appears on job boards is a subset of the true market, and the candidates for those roles are often already in conversation before the listing goes live.
The seasonal pattern holds consistently across every salary level. Salary doesn't change when it’s best to apply. But if you're targeting six-figure roles, speed is non-negotiable as the listing may be live for days, not weeks.
All industries follow the same broad seasonal calendar of Q3 peak, Q1 groove, December dip. The story across sectors isn't about timing differences. It's about how much more competitive some fields are per listing, and what that means for how urgently you need to act.
IT & Technology records nearly 10 times higher click rate than Bio & Pharma & Health. Several forces drive this. First, technology roles attract a broad applicant funnel. For example, a listing for a Senior Product Manager will draw applications from software engineers pivoting into product, consultants who've worked in tech, analysts across industries who've developed the relevant tools. The pool is wide and well-prepared.
Second, tech workers tend to be highly networked and very informed. Many are on job boards regularly, even when not actively searching. It’s a habit built during the volatility of 2022-2023 layoffs, which made passive job market monitoring a professional norm in the industry.
Marketing & Media is close behind IT, which likely reflects a structural imbalance between supply and demand. Marketing is a field where formal qualifications are less of a barrier than in engineering or law, so the applicant pool for any given role is exceptionally broad. The same goes for Content Manager roles that might attract applications from journalists, copywriters, social media managers, and PR professionals because they all see the same listing as relevant to them.
The inverse case is Bio & Pharma & Health, with the lowest first-day engagement per listing of 7 clicks per 1,000 jobs. The explanation is likely connected to credential-based gatekeeping. A role in pharmacology, clinical research, or biotechnology typically requires specific degrees, certifications, or regulatory experience that substantially narrows the eligible applicant pool. This represents a meaningful structural advantage for qualified healthcare and pharma applicants.
That said, one exception is worth noting: Bio & Pharma shows unusual Q4 resilience. Q4 clicks (32,000) nearly match Q3 (34,000), unlike other industries where Q4 drops 25-35%. This likely reflects year-end healthcare budget cycles and regulatory-driven hiring. Some pharma hiring is tied to clinical trial timelines or FDA approval milestones rather than the broader corporate calendar.
Seniority doesn't change when you should apply. Every level, from Specialist to Managing Director, follows the same pattern of busy Q3 and slow pick up in Q1. But seniority absolutely changes how fast you need to move, and how concentrated the competition is per available role.
Managing Director roles attract nearly four times the competition intensity of Specialist-level roles. VP roles are similarly concentrated as Managing Director roles.
The primary driver is supply scarcity. Senior positions are rare enough that when one appears, it triggers immediate action from a large pool of qualified candidates who've been waiting for exactly that opportunity. Many senior job seekers are in a “passive alert” mode, which means they're not actively searching but they have notifications set.
There's also a network effect at senior levels. Many MD and VP listings are shared within professional networks before, or alongside, their public posting. If a role goes live on a Monday, a significant proportion of the qualified applicant pool may already know about it through LinkedIn connections, recruiters, or industry contacts. That compresses the effective day-one window even further.
Specialist-level roles are highly seasonal, with Q3 engagement roughly 3 times Q1 levels. Whereas, Managing Director roles are considerably steadier, with a ratio of just 2 times.
The likely explanation is that senior hiring operates on a different timeline to bulk recruitment. When a company needs to replace a Director or above, the urgency often overrides the calendar. Executive searches also tend to take longer, often three to six months from mandate to offer.
Job searching isn't just about what you apply for. It's about when, and how fast. Here's what the data from over 55 million US job listings says to do.
This is the single most impactful move you can make. Applying within the first 24 hours puts you ahead of 65-80% of first-week applicants. The advantage holds in any month, any industry, at any seniority level. Most jobs get marginally less clicks on day one, so that window is yours to use. Make sure you have job alerts set on the platforms you use, check them daily, and have a version of your CV and cover letter ready to deploy quickly.
May is the peak hiring month, but March is when the ratio of listings to active competition is most favourable. Starting in March is a key part of any well-timed job search strategy. This way, you enter the market before the spring surge brings in the crowd. If you miss spring, September-October is the next best entry point. Though autumn listings tend to fill faster, which suggests that urgency matters more in the autumn window than in the spring one.
Monday and Tuesday together account for 36% of weekly application activity. Getting your application in before that surge, on Saturday, Sunday, or first thing Monday, means it's already in the recruiter's queue when the peak week begins. The Sunday Scaries work in your favour if you're already ahead of the crowd. A Saturday application to a Thursday listing will look like an early response, whereas the same application sent on Tuesday will be one of dozens.
Most job search advice tells you what to do. Almost none of it tells you when.
That's the gap. JobLeads analyzed over 55 million US job listings and 143 million user interactions, and the clearest signal wasn't about seasons or hiring cycles. It was about speed. Apply within 24 hours of a listing going live and you're already ahead of the majority of the field.
The calendar has a shape. But fast beats clever every time.
JobLeads aggregates fresh listings from across the web and puts them in front of you the moment they go live. This way, the next right role doesn't slip past you while you were busy on a Tuesday.
This article is based on a proprietary analysis of JobLeads' US job listings database and user interaction logs. Four measurement sets were used.
A total of 54,856,186 US job listings in 2025 were analyzed. Interaction data draws on approximately 143 million user click and apply events across the analysis period.
Candidate sentiment data draws on a LinkedIn poll conducted by JobLeads in 2025. Respondents were asked whether they had applied to jobs they suspected were never real. A total of 2,395 votes were recorded.
Limitations:
If this research helped inform your understanding of job search timing, you're welcome to reference or share any of the findings and statistics from this study. We ask that you credit JobLeads as the source and include a link back to this page so your readers can explore the full dataset and methodology.

Content & Insight Writer
Beata creates content that puts job seekers first. From practical blog advice to first-hand research studies, her writing is designed to give people the clarity and confidence to find the role they deserve.
Job Market TrendsUnderstand the state of remote work in the US in 2026 with JobLeads data on hiring demand, industry trends, regional patterns, and worker preferences.
 Job Market Trends
JobLeads analyzed behavioral data from 881,776 U.S. job seekers to better understand how the gender pay gap develops throughout the job search process. The study finds that women ultimately earn 83 cents for every dollar men earn, but that difference is shaped long before a paycheck is issued.
 Job Market Trends
Our survey of 43,000+ job seekers reveals why most never access the hidden job market, and the strategies that actually work to change that.