
 Job Search
May 20, 2024
Why do companies want experience for entry-level roles?
Are you tired of companies demanding experience for entry-level jobs? Here’s why they do it, and how to beat them at their own game.


In the first half (H1) of 2026, US entry-level jobs amounted to just about 1% of total active jobs. This number rises to 3% of total active jobs when looking at the UK.
But that doesn't draw the whole picture.
Across the four UK nations combined, entry-level roles fell about 5% between H1 2025 and H1 2026. In the UK's 26 largest entry-level markets, the drop deepens to 20%.
Moreover, Jobs per company (JPC)–how many entry-level roles the average employer advertises at once–fell in every single city analyzed. From an average of 2.13 in H1 2025 to 1.54 in H1 2026, a 28% decline. This means that the typical employer now lists one or two entry-level openings, down from two or three.
This analysis is drawn from JobLeads' UK entry-level job-postings dataset: 442,726 postings collected between August 2024 and July 2026.
Recent news announced that UK retailers seek to create 100,000 jobs for young unemployed over the next 3 years (Global Banking & Finance). That is needed, but is it enough to offset the issue?
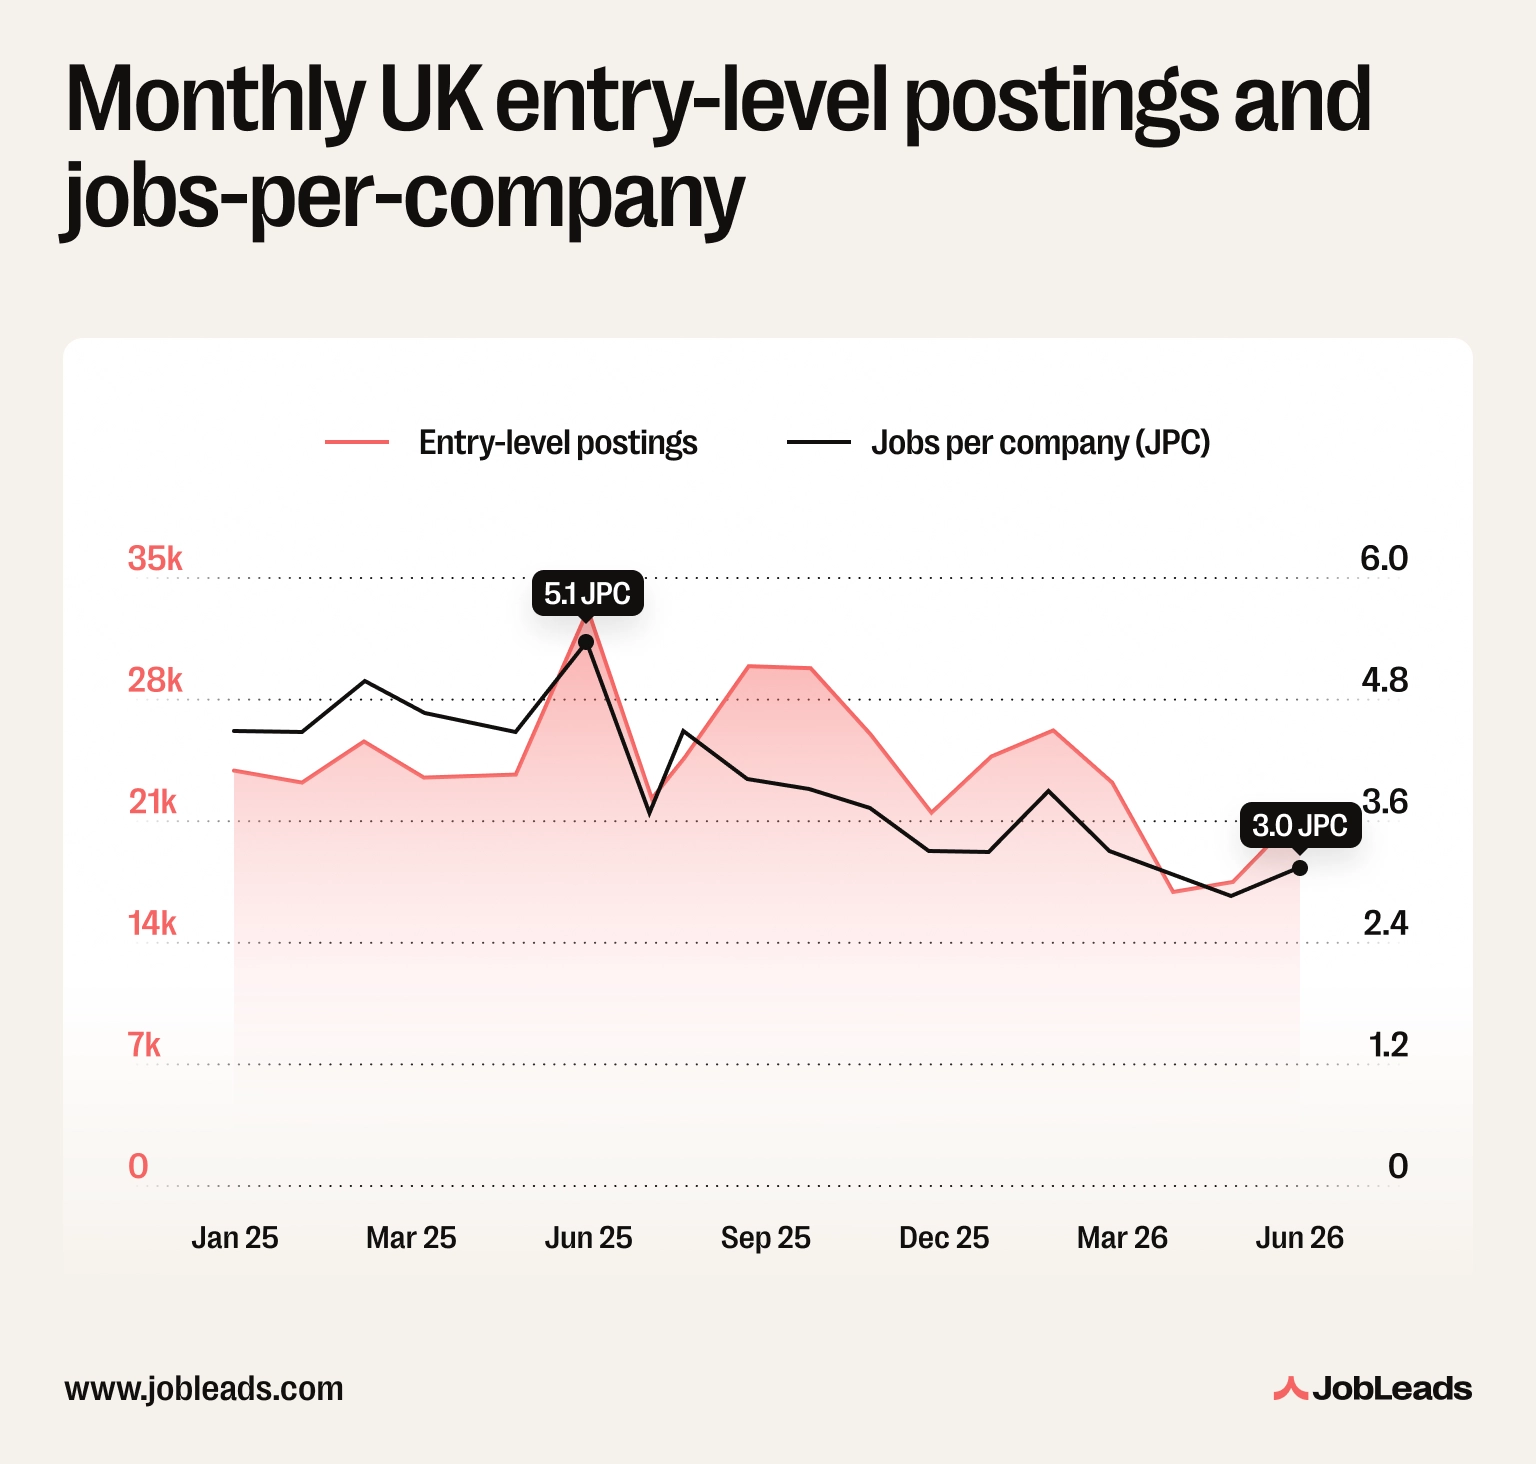
Across the UK's 26 largest entry-level job markets, jobs-per-company (JPC) fell in every single one, from these 26 cities average of 2.1 in H1 2025 to 1.5 in H1 2026, a 28% decline. Weighting by city size gives the same result, which means no single large city is driving this pattern.
Posting volume fell too, across all 26 cities, by 20% (from 57,914 to 46,254).
Fewer jobs, but not fewer employers. Our estimate says about 11% more companies were hiring entry-level staff in these cities than a year earlier–each simply advertising fewer roles. The market didn't lose employers; employers shrank their openings.
This isn't isolated to JobLeads' data. An analysis found UK entry-level hiring down 14% year-over-year as of April 2026, with 30 of the 38 occupations it tracks in decline (DSIT & LinkedIn). The steepest drops were concentrated in knowledge-sector roles:
While presence-based roles like Retail Assistant (+25%) and Sales Development Representative (+17%) grew.
The pattern is clear: fewer knowledge-work openings, more customer-facing ones. This points to a market where roles are shifting, not disappearing.
| # | City | Entry-level jobs per company H1 25 | Entry-level jobs per company H1 26 | Entry-level jobs per company difference | Change in the number of entry-level jobs % |
|---|---|---|---|---|---|
| 1 | Plymouth | 2.1 | 1.3 | -0.8 | -40.9% |
| 2 | Aberdeen | 2.1 | 1.6 | -0.5 | -39.2% |
| 3 | Swindon | 2.3 | 1.4 | -0.9 | -36.7% |
| 4 | Milton Keynes | 2.1 | 1.5 | -0.6 | -33.9% |
| 5 | Warrington | 2.5 | 1.5 | -1.0 | -31.2% |
| 6 | Sheffield | 2.1 | 1.4 | -0.7 | -30.9% |
| 7 | Leicester | 2.0 | 1.3 | -0.7 | -30.7% |
| 8 | Bristol | 2.5 | 1.7 | -0.8 | -30.2% |
| 9 | Reading | 2.2 | 1.7 | -0.5 | -25.6% |
| 10 | Northampton | 2.1 | 1.4 | -0.7 | -25.1% |
| 11 | Exeter | 2.0 | 1.5 | -0.5 | -24.6% |
| 12 | Nottingham | 2.2 | 1.5 | -0.7 | -24.4% |
| 13 | Norwich | 2.0 | 1.4 | -0.6 | -24.1% |
| 14 | Southampton | 2.0 | 1.6 | -0.4 | -23.4% |
| 15 | Edinburgh | 2.1 | 1.5 | -0.6 | -19.9% |
| 16 | Birmingham | 2.3 | 1.8 | -0.5 | -19.0% |
| 17 | London (metro) | 2.4 | 1.7 | -0.7 | -17.6% |
| 18 | Brighton | 2.0 | 1.5 | -0.5 | -16.4% |
| 19 | Newcastle upon Tyne | 2.1 | 1.6 | -0.5 | -15.5% |
| 20 | Cambridge | 1.8 | 1.6 | -0.2 | -13.8% |
| 21 | Glasgow | 2.1 | 1.7 | -0.4 | -13.5% |
| 22 | Leeds | 2.3 | 1.7 | -0.6 | -12.0% |
| 23 | Belfast | 2.1 | 1.5 | -0.6 | -11.8% |
| 24 | Cardiff | 1.9 | 1.6 | -0.3 | -11.3% |
| 25 | Liverpool | 2.0 | 1.4 | -0.6 | -9.5% |
| 26 | Coventry | 2.1 | 1.6 | -0.5 | -6.3% |
London (metro)–the largest single market for entry level jobs in the UK by a wide margin–fell by 18% of entry-level postings. London is following the same trend as everywhere else: fewer job openings, and more competition for each one.
The steepest percentage drops were elsewhere: Plymouth (-41%), Aberdeen (-39%), Swindon (-37%), Milton Keynes (-34%), and Warrington (-31%). At the other end, Coventry (-6%), Liverpool (-10%), and Cardiff (-11%) held up best.
Jobs per company (JPC) fell in every city too, with no exceptions. The largest drops were in Warrington (2.5 → 1.5), Swindon (2.3 → 1.4), Bristol (2.5 → 1.7), and Plymouth (2.1 → 1.3). The smallest drops were in Cambridge (1.8 → 1.6), Cardiff (1.9 → 1.6), and Southampton (2.0 → 1.6).
City size and how exposed each local economy is to any single industry don't appear to have mattered enough to produce a single exception, on either metric, across the 26 cities tracked. Whatever is driving this, it is a story about the norm across the UK's largest entry-level markets.
The city-level picture above raises an obvious question: does the same pattern hold once you zoom out to the UK's four nations? Not quite–and that exception is worth a closer look, even though it falls outside the 26 cities this piece otherwise focuses on.
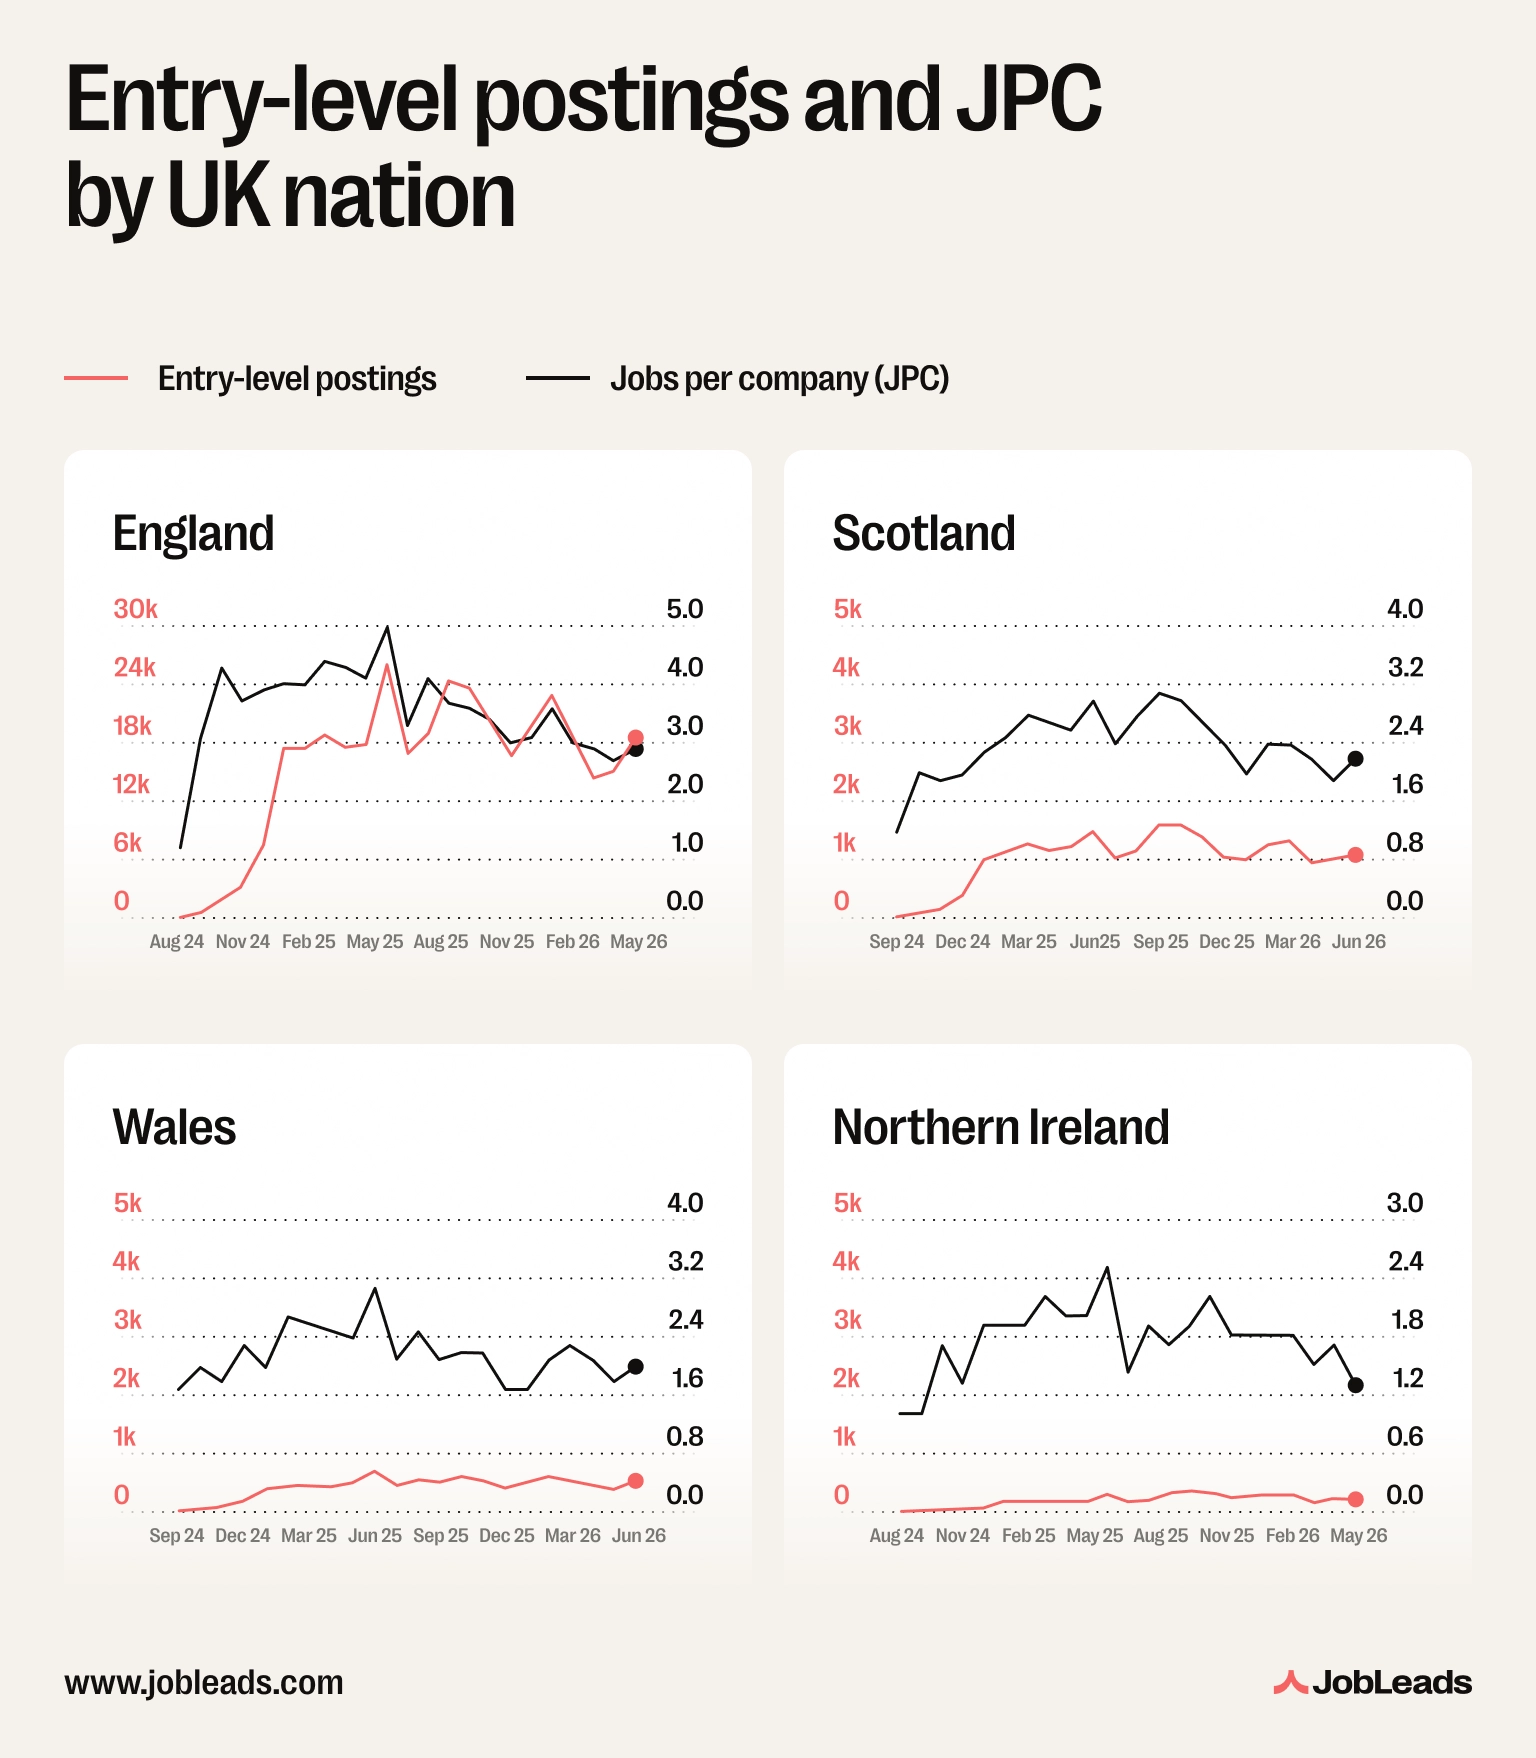
England accounts for roughly 86% of UK entry-level jobs in H1 2026, so its trend dominates the national picture. Postings in all cities combined fell 5% between H1 2025 and H1 2026, and JPC fell from 4.30 to 3.03. Scotland, the second-largest nation by volume, fell further in percentage terms–down 10%.
Wales and Northern Ireland moved the opposite way. Welsh postings grew 3%, and Northern Ireland grew 21%–the fastest of any UK nation, though off the smallest base. Neither is large enough to offset England and Scotland's declines in absolute terms, but the direction matters: entry-level hiring did not contract everywhere.
Notably, Wales and Northern Ireland both have only one city large enough to appear in the 26 cities above (Cardiff and Belfast) and they both declined. So whatever is driving national growth in these two nations, it's happening in smaller towns this piece doesn't cover.
Jobs per company (JPC) fell in all four nations regardless of whether volume rose or fell. England's JPC dropped from 4.30 to 3.03, Scotland's from 2.65 to 2.18, Wales's from 2.55 to 2.00, and Northern Ireland's from 2.08 to 1.65. Even in the two nations gaining postings, individual employers are hiring in smaller batches than they were a year ago.
Northern Ireland's outperformance also shows up in the official record. ONS regional labour market data found payrolled employee numbers falling across every UK region and nation in May 2025 except Northern Ireland, where they rose 0.8% year-on-year. It's a different metric and a different month than our entry-level comparison, but the direction lines up: Northern Ireland has been bucking the wider UK slowdown for some time.
Across the UK's 26 cities, postings fell in every single one, a combined 20% drop. But look at how many entry-level roles the average hiring employer has opened and the picture starts to form. This number fell from 2.13 to 1.54.
By our own estimate, roughly 11% more companies were hiring. Each was just doing less of it.
Two forces look like plausible drivers. One is cost: April 2025's rise in employer National Insurance contributions, alongside a steeper minimum-wage increase for under-21s. The other is AI: government analysis has already found that the skills entry-level candidates offer concentrate in the same knowledge-sector roles where AI tooling has advanced fastest.
Whatever the cause, a response is already arriving.
In September 2026, more than 40 UK retailers–including Aldi, Asda, Tesco, and Marks & Spencer–pledged to create up to 100,000 placements and jobs for unemployed 18-to-24-year-olds by 2029. It's a three-year bet that the private sector can out-hire the trend this data describes.
Moreover, speaking at the Labour Party conference on 28 September 2026, Chancellor John Healey argued that the best thing government can offer young people is not a benefits payment but "a first job with a wage and with a future", announcing £100 million for a new Local Apprenticeship Service aimed at the almost one million young people not in employment, education or training (ITV News).
Whether these initiatives can outpace a market where the average employer advertises 28% fewer entry-level roles than a year ago is, for now, an open question.
This piece focuses on a comparison of H1 2025 (January–June 2025) and H1 2026 (January–June 2026) across the UK's 26 largest entry-level job markets. These are the cities with at least 500 entry-level postings in both halves.
Nation-level figures (England, Scotland, Wales, Northern Ireland) are addressed in one dedicated section only; the rest of this piece deliberately stays at the city level.
Both scopes draw on the same underlying JobLeads platform dataset: UK job postings across all four nations, matched by a two-layer entry-level keyword filter applied to both the job title and the description/summary.
Postings are deduplicated by job ID, and only parent postings are counted–child/duplicate listings under a shared parent posting are excluded, as are postings that fail either layer of the entry-level keyword match. Also, postings with no identifiable nation or city were excluded from the analysis.
The full underlying dataset spans 1 August 2024 to 31 July 2026 and contains 442,726 rows across 34,654 distinct companies (in the most recent 12-month period); data is current as of 1 September 2026. External context throughout is drawn from ONS, DSIT/LinkedIn, and Resolution Foundation publications: full citations below.
Jobs-per-company (JPC) is calculated as total postings divided by the number of unique company-name values within a given grouping (city or nation, for the H1 2025 and H1 2026 halves). Company identification uses the company name field rather than an internal company ID, chosen for more reliable distinct-company counts; small name variants for the same real-world employer may therefore slightly understate true company concentration.
US entry-level jobs were analyzed in H1 2026 for comparison and amounted to 1.03% of total active jobs in H1 in the US.
Limitations:
Journalists and media organizations are welcome to reproduce charts and data from this article with attribution to JobLeads and a link to this page. Please do not reproduce the article in full without permission. For additional data or interviews, contact press@jobleads.com.

Content & Insight Writer
Beata creates content that puts job seekers first. From practical blog advice to first-hand research studies, her writing is designed to give people the clarity and confidence to find the role they deserve.
Job SearchAre you tired of companies demanding experience for entry-level jobs? Here’s why they do it, and how to beat them at their own game.
 Job Market Trends
Our survey of 43,000+ job seekers reveals why most never access the hidden job market, and the strategies that actually work to change that.
 Resume
Craft a standout resume summary with our expert tips for entry-level job seekers lacking experience. Land that job with confidence!